Get Indexology® Blog updates via email.

In This List

Resilience to Rising Carbon Prices: Do Eurozone S&P PACT Indices Stand the Test?

Information Technology Has Evolved to Become a Consistent Presence in the S&P 500 Low Volatility Index

No Time to Thrive

Let's Talk about Survivorship – SPIVA Latin America Scorecard

Can Equal Weight ESG Indices Pull Their Weight?

Resilience to Rising Carbon Prices: Do Eurozone S&P PACT Indices Stand the Test?

Contributor Image
Barbara Velado

Senior Analyst, Research & Design, Sustainability Indices

S&P Dow Jones Indices

“Code red for humanity.” That’s how the imminent effects of climate change were described by the UN.1 Human-induced global warming stands at 1.1°C above pre-industrial levels, and will likely reach more than 2.7°C by 2100.2 If the world is to achieve the goals of the Paris Agreement and limit global warming to 1.5°C, decarbonization is the answer. The S&P PACTTM Indices (S&P Paris-Aligned & Climate Transition Indices) aim to align with the Paris Agreement goals and be compatible with net-zero emissions by 2050.

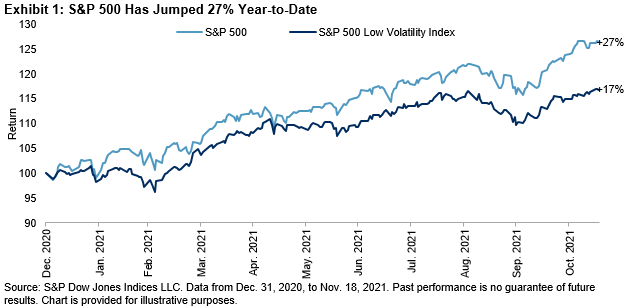
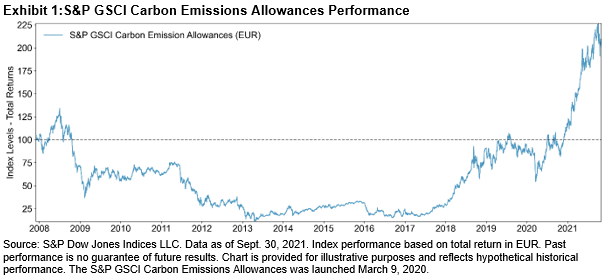
Carbon pricing encourages companies to reduce greenhouse gas (GHG) emissions, accelerating the transition to a low-carbon economy. Growing carbon prices have been observed within the EU Emissions Trading Scheme, whose price has surged 126.58% in one year.3

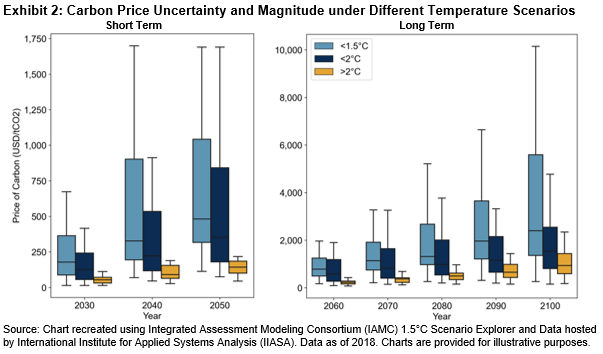
To curb global warming to 1.5°C, carbon prices would likely need to increase dramatically over the upcoming decades, much more than if that target were pushed to above 2°C. However, the uncertainty surrounding that increase is huge. Naturally, this translates into potential financial risk, as companies would have to either absorb the additional cost of their carbon emissions or pass it on to consumers—the so-called carbon price premium.

Using S&P Global Trucost’s Carbon Earnings at Risk dataset, we test whether the eurozone S&P PACT Indices show more financial resilience to a growing carbon price, or rather, if we observe lower portfolio earnings at risk, relative to its benchmark. Trucost developed the following three carbon price pathways.

  1. Low carbon price reflecting countries’ NDCs4
  2. Medium carbon price assuming a 2°C goal, but with short-term action delayed
  3. High carbon price aligned with the 2°C goal of the Paris Agreement

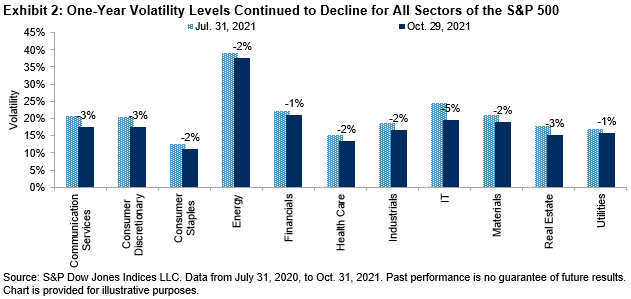
Sectors have different exposures to this transition risk, with Utilities and Materials being some of the most vulnerable to soaring carbon prices, given their operational nature.5

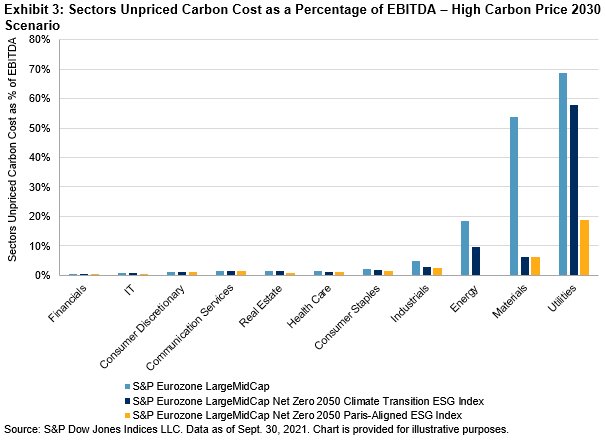
We examine the proportion of the eurozone S&P PACT Indices earnings at risk from potential rising carbon prices, as a percentage of earnings before interest, tax, depreciation, and amortization (EBITDA). Both the S&P Paris-Aligned (PA) Index and S&P Climate Transition (CT) Index carbon earnings at risk were lower than the underlying S&P Eurozone LargeMidCap under each scenario from 2020 to 2050.

If the world aligns with the Paris Agreement goals and adopts a high carbon price (shown by the dark purple bars and yellow lines), that implies both the PA and CT indices have 8.99% and 6.50% less portfolio earnings at risk by 2030 relative to their underlying index, respectively.6 When looking at 2050, that increases to 15.86% and 11.36%.

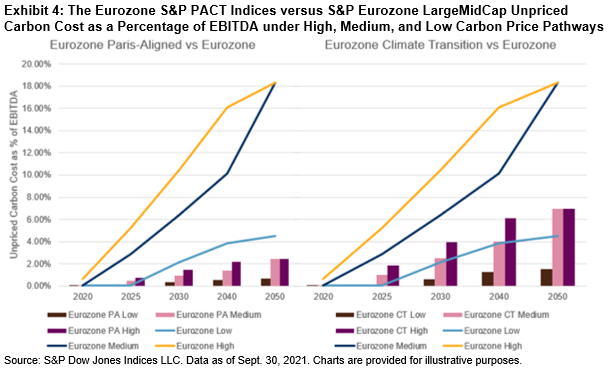
Trucost’s models suggest that the eurozone S&P PACT Indices are more financially robust on a forward-looking basis than their underlying market-cap-weighted index. The magnitude of their potential climate resiliency would be dependent on the specific climate trajectory the world ends up pursuing.

1 UN Secretary-General António Guterres’ statement on the Intergovernmental Panel on Climate Change (IPCC) Working Group 1 report on the physical science basis of the sixth assessment, available here.

2 Based on the Nationally Determined Contributions (NDCs)and pledges submitted as of 2020, the world is on track for 2.7°C of warming, according to the contribution from Working Group I on the IPCC AR6 Report: Climate Change 2021: The Physical Science Basis.

3 As of Sept. 30, 2021.

4 NDCs form the basis for countries to achieve the objectives of the Paris Agreement. They contain information on targets, policies, and measures for reducing national emissions and on adapting to climate change impacts (UNFCC, 2021).

5 Please note Trucost’s Carbon Earnings at Risk dataset only includes Scopes 1 and 2 of GHG emissions.

6 All data as of Sept. 1 2021.

The posts on this blog are opinions, not advice. Please read our Disclaimers.

Information Technology Has Evolved to Become a Consistent Presence in the S&P 500 Low Volatility Index

Contributor Image
Fei Mei Chan

Former Director, Core Product Management

S&P Dow Jones Indices

Equities in 2021 had a slow start, but as December approaches it looks to be another stellar year. Through Nov. 18, 2021, the S&P 500® was up 27%. For a strategy that is explicitly designed to mitigate risk, the S&P 500 Low Volatility Index’s year-to-date gain of “only” 17% is well within the range of reasonable expectations.

One-year volatility declined across all sectors of the S&P 500, with Information Technology experiencing the largest reduction.

Changes in the latest rebalance for the S&P 500 Low Volatility Index, effective after the market close on Nov. 19, 2021, were small. Notably, IT still holds a significant weight (9%) in the context of the history of the low volatility index. Since 2017, it has maintained a weight of 5% or more in the low volatility index, the lengthiest run in index history back to 1991.

Health Care pared its weight to 12% of the index. Consumer Staples, Utilities, and Industrials together accounted for more than half of the index. Energy’s weight remained at 0%.

For the broader S&P 500, IT’s underweight is still the largest difference between the S&P 500 Low Volatility Index and the S&P 500. The overweights in Utilities and Consumers Staples pick up the slack on the other end of the spectrum.

The posts on this blog are opinions, not advice. Please read our Disclaimers.

No Time to Thrive

Contributor Image
Sherifa Issifu

Senior Analyst, U.S. Equity Indices

S&P Dow Jones Indices

S&P DJI has just released the final regional edition of our S&P Index Versus Active (SPIVA®) Mid-Year 2021 Scorecards. The semiannual reports cover the performance of actively managed funds in the U.S., Canada, Latin America, Europe, South Africa, India, Japan, Australia, and our newest regional addition, the Middle East and North Africa (MENA). SPIVA Scorecards offer a wealth of insights into the performance of active funds globally, including the percentage of all the available actively managed funds that underperformed an appropriate S&P DJI benchmark over various time horizons. Exhibit 1 summarizes the performance of domestically focused active funds across the various regions over the one-year period ending in June 2021.

In every region apart from Australia, most active funds underperformed. Intriguingly, although we often hear that index-based strategies “don’t work” as well in Emerging Markets, the rate of underperformance  was generally higher in those markets: 86% of Indian active managers failed to beat the S&P BSE 100, with similar underperformance among Mexican and Brazilian funds. This speaks to the shrinking alpha that is often seen as markets increasingly professionalize; put simply, it becomes harder and harder to remain “above average.”

Beyond the headline figures, the biannual reports dig into a wide range of specialized equity and fixed income fund categories and, as usual, the latest reports identify a few pockets where active managers had more reason to boast, and those markets where outperformance was hardest to find. Exhibit 2 shows the top underperforming and outperforming fund categories across all our regional reports. Canadian Dividend & Income Equity funds had the largest rate of underperformance, with more than 98% of funds underperforming the S&P/TSX Canadian Dividend Aristocrats®. At the other end of the spectrum, U.S. bond fund managers, in particular, stood out for their benchmark-beating returns (although the excellent 12-month record in the Government Long, U.S. Government/Credit Long, and Emerging Markets Debt fund categories is qualified by close to 100% underperformance over a 10-year horizon). The most extreme case of outperformance was among South African Short-Term Bond funds, with only 8% of active managers underperforming the STeFI Composite.

Turning to cross-region comparisons (summarized in Exhibit 3), the best active U.S. equity managers over the one-year period ending in June 2021 were, perhaps surprisingly, more likely to sit on a different continent than the stocks they managed, with 51% of Japanese and European active U.S. equity managers underperforming the S&P 500, versus the U.S.’s 58%. However, over the long run, U.S. active managers did achieve a better outperformance rate than other regional managers, not only in U.S. equities, but also across Global and Emerging Market equity market categories, too.

Explore the latest SPIVA scorecards at https://www.spglobal.com/spdji/en/research-insights/spiva/.

The posts on this blog are opinions, not advice. Please read our Disclaimers.

Let's Talk about Survivorship – SPIVA Latin America Scorecard

Contributor Image
Maria Sanchez

Director, Sustainability Index Product Management, U.S. Equity Indices

S&P Dow Jones Indices

The saying goes, “What does not kill you makes you stronger,” but could that strength translate into a greater chance of survival? Perhaps, especially if all future risks were equal or sufficiently similar to the one that was survived—assuming, of course, that one learned from that first experience.

The survival of mutual funds could follow the same premise. Unfortunately, every day is different; economic, political, and public health circumstances constantly change, making each market observation an independent event.

The S&P Indices Versus Active (SPIVA®) Latin America Scorecard compares the performance of actively managed mutual funds in Brazil, Chile, and Mexico to their benchmarks over 1-, 3-, 5-, and 10-year periods.

In the mid-year 2021 scorecard, we observed fund survivorship from December 2014 to June 2021 (14 semiannual reports) under all categories and horizons covered by the report.[1] In the case of the 10-year period, data is only available from December 2018 to June 2021 (six semiannual reports).

In Exhibit 1, we can see that the highest survival rates in all categories were in the one-year period, while the lowest survival rates were in the 10-year period—the longer the observation window, the lower the probability of survival.

It can also be observed that both the 1- and 10-year periods presented lower dispersion compared with the 3- and 5-year periods. The category with the highest dispersion in all observation periods was Brazil Corporate Bond Funds and the category with the lowest dispersion in all observation periods was Mexico Equity Funds.

To see the latest active versus passive results including the fund survivorship report, please see the SPIVA Latin America Mid-Year 2021 Scorecard.

[1] The categories covered in the SPIVA Latin America Scorecard are: Brazil Equity Funds, Brazil Large-Cap Funds, Brazil Mid-/Small-Cap Funds, Brazil Corporate Bond Funds, Brazil Government Bond Funds, Chile Equity Funds, and Mexico Equity Funds.

The posts on this blog are opinions, not advice. Please read our Disclaimers.

Can Equal Weight ESG Indices Pull Their Weight?

Contributor Image
Ben Leale-Green

Former Associate Director, Research & Design, ESG Indices

S&P Dow Jones Indices

Research has shown that equally weighted indices have historically posted long-term outperformance1 over their benchmarks—largely driven by their exposures to small size and value along with associated risk premia, in addition to a healthy dose of concentration reduction.2 However, in accessing compensated factors and reducing concentration, the S&P 500® Equal Weight Index could elicit some undesirable ESG consequences.

With many investors looking to integrate ESG considerations into their portfolios, is it possible to gain the benefits of equal weighting while incorporating ESG criteria? This question raises three sub-questions.

  • Can ESG benefits be gained relative to the S&P 500 Equal Weight Index?
  • Can factor exposures associated with equal weighting be gained within an ESG framework?
  • Can we reduce concentration in a few names, while excluding companies that are undesirable from an ESG standpoint?

To give the game away early (in case you want to stop reading here): yes, yes, and yes.

Before addressing these questions, it helps to understand how the index is constructed (see Exhibit 1).

Based on this index construction, how does the S&P 500 Equal Weight ESG Leaders Select Index perform? We can see an excess return over the S&P 500 Equal Weight Index (see Exhibit 2), with comparable volatility, realizing an improved risk-adjusted return over each period examined historically (see Exhibit 3).

Can ESG benefits be gained? There were large improvements in both the S&P DJI ESG Score and carbon intensity1 at the index level, with the S&P 500 Equal Weight ESG Leaders Select Index relative to the S&P 500 Equal Weight Index achieving a stronger ESG profile and lower carbon footprint (see Exhibit 4).

Can factor exposures be maintained?  The only significantly difference in exposure we can see is small size, as the S&P 500 Equal Weight ESG Leaders Select Index is not quite as exposed. But it still has more exposure to small size compared to the market-cap-weighted S&P 500 or S&P 500 ESG Index.

Can we reduce concentration within an ESG Framework? While there is more weight in the largest stocks in the ESG equally weighted index than in the S&P 500 Equal Weight Index, there is still a large concentration reduction from cap weighting—relative to either the S&P 500 or S&P 500 ESG Index.

Ultimately, if the factor exposures and concentration reduction of equally weighted indices with an improved ESG footprint sounds good, the S&P 500 Equal Weight ESG Leaders Select Index may be a good fit.

1 Historical long-term outperformance was over market-cap-weighted indices.

2 Rashid (2021) shows equally weighted indices have performed well during economic recovery. Bellucci & Gunzberg (2018) and Edwards, Lazzara, Preston & Pestalozzi (2018) highlight increased exposure of equal weighted indices to small size and value, while Ganti (2021) observes value exposures by equally weighted indices. Edwards, Lazzara, Preston, & Pestalozzi (2018) and Preston (2021) discuss benefits of concentration reduction.

3 We define carbon intensity as Scope 1 + Scope 2 + Scope 3 emissions/enterprise value including cash (EVIC

The posts on this blog are opinions, not advice. Please read our Disclaimers.