Get Indexology® Blog updates via email.

In This List

SPIVA Japan Scorecard 2023: Misfortune for Japanese Stock Pickers

Exploring the Growing Thematics Landscape

Measuring Munis: Using Indices to Assess Yield Opportunities

Commodities Deliver Double-Digit Returns in the Face of Stubborn Inflation

Meet the New and More Diversified S&P/BMV IPC

SPIVA Japan Scorecard 2023: Misfortune for Japanese Stock Pickers

Contributor Image
Sue Lee

Director and APAC Head of Index Investment Strategy

S&P Dow Jones Indices

Since the first publication of the S&P Indices Versus Active (SPIVA®) U.S. Scorecard in 2002, S&P Dow Jones Indices has regularly reported on the relative performance of actively managed funds versus benchmark indices across an increasing number of global fund markets and fund categories.1

The SPIVA Japan Scorecard has been tracking the performance of active funds offered in Japan since 2014, covering large-, mid- and small-cap segments, as well as international and global equity funds. Over these years, we found that a significant majority of active funds in Japan underperformed their assigned benchmark in each of our reported fund categories. Exhibit 1 summarizes the underperformance rate of active funds in Japan over the 1-, 3-, 5- and 10-year periods ending on Dec. 31, 2023, across different fund categories.

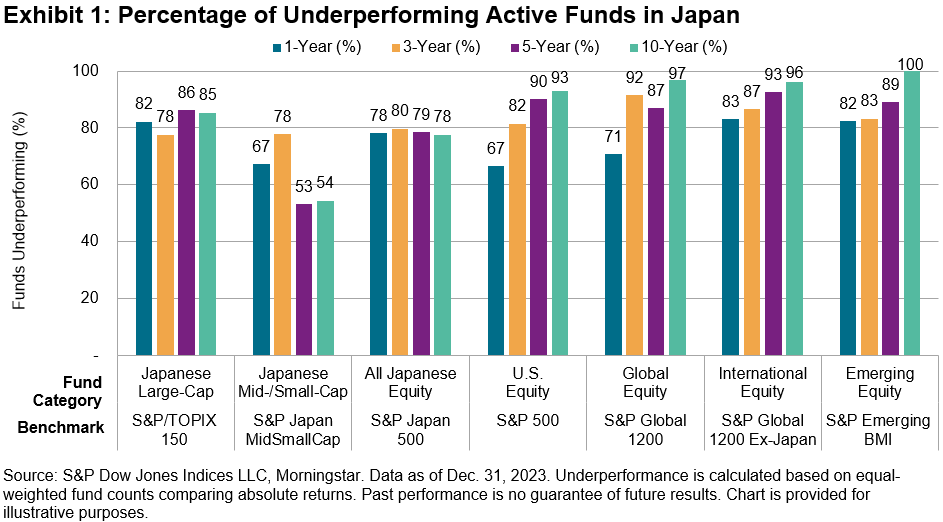
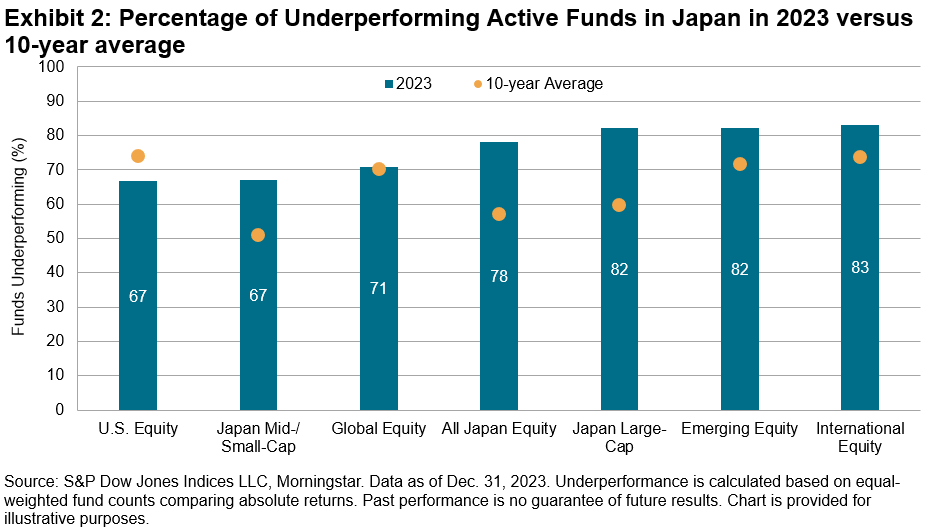
While 2023 marked an epic turnaround for Japanese equities with a reprieve from long-suffering deflation, it was a challenging year for Japanese active managers. 78% of Japanese domestic equity funds (All Japan Equity category) underperformed the broad-based S&P Japan 500 over the full year 2023. Furthermore, over two-thirds of equity funds underperformed their benchmarks in every reported category, posting underperformance rates worse than their 10-year averages in nearly all categories except for the U.S. Equity (see Exhibit 2).

What could explain last year’s misfortune of Japanese active fund managers? Among many possible explanations, we found three market conditions that posed challenges for active managers.

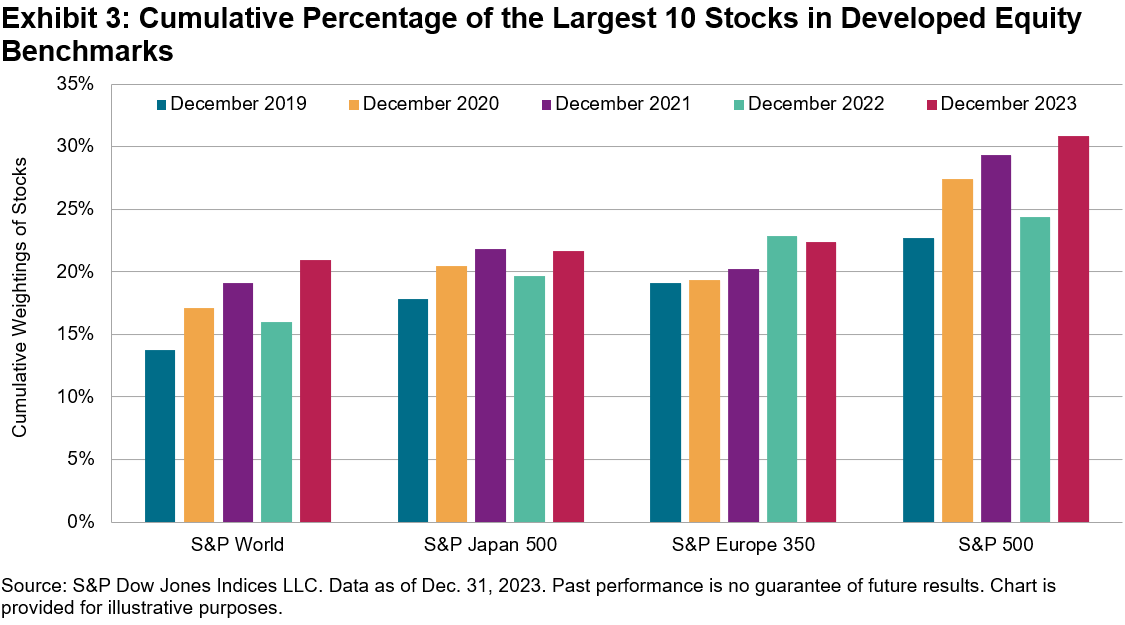
  1. Large-cap outperformance: The outperformance of large-cap companies was one of the key market trends in 2023. This was well publicized in the U.S. market with the so-called “Magnificent Seven,” namely Apple, Amazon, Alphabet, Meta, Microsoft, Nvidia and Tesla, which contributed 58% of the S&P 500®’s return in 2023. Similarly in Japan, the large-cap S&P/TOPIX 150 outperformed the S&P Japan MidSmallCap by 4% in 2023, resulting in increased market concentration (see Exhibit 3). This environment would have worked against active managers who searched for a source of outperformance among smaller, lesser-known names.
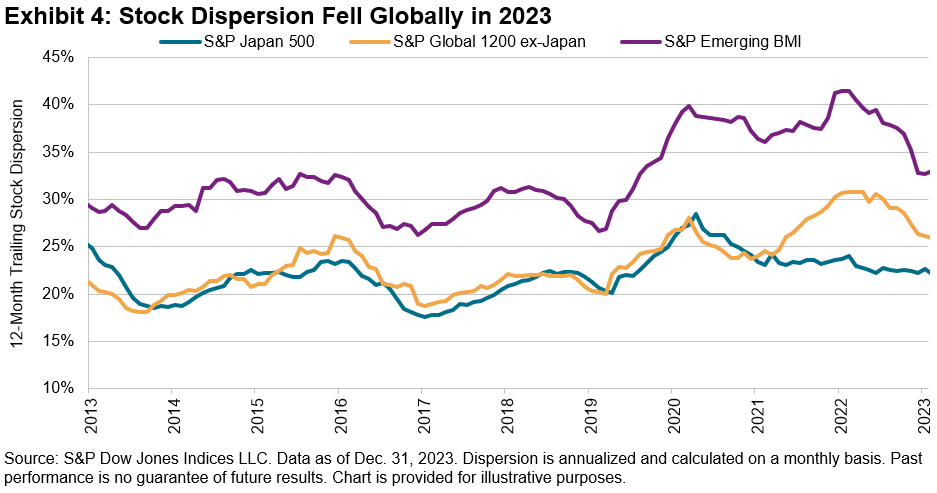
  2. Falling dispersion: Dispersion,2 the degree to which stocks differ from the average performance, measures the opportunity set for active managers to outperform through stock selection. Dispersion moved lower globally in 2023, though it remained elevated relative to its history (see Exhibit 4), which points to reduced opportunities for active managers overall.
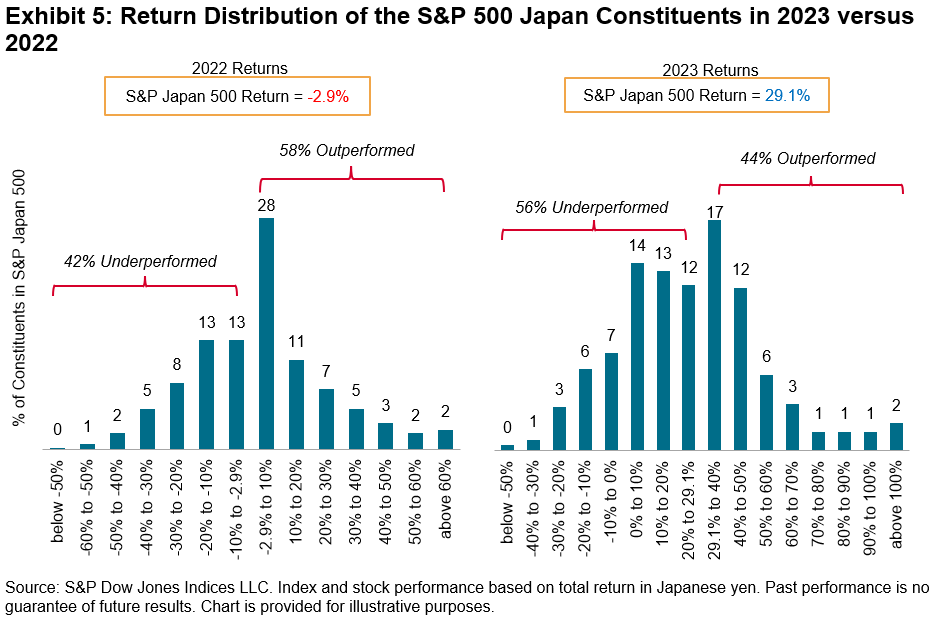
  3. Return distribution: Stating the obvious, when fewer stocks outperform the benchmark, it becomes less likely for managers to find them. In 2023, the percentage of constituents outperforming their benchmark fell well below 50% across domestic and global benchmarks amid a strong market rally. In Japan, the percentage of constituents outperforming the S&P 500 Japan dropped from 58% in 2022 to 44% in 2023 (see Exhibit 5).

To learn more, we invite you to explore the results of our SPIVA Japan Year-End 2023.

1 See SPIVA Around the World and SPIVA Fixed Income Around the World for the latest results of equity and fixed income funds across all covered markets.

2 See Tim Edwards and Craig J. Lazzara, “Dispersion: Measuring Market Opportunity,” S&P Dow Jones Indices LLC, 2014


The posts on this blog are opinions, not advice. Please read our Disclaimers.

Exploring the Growing Thematics Landscape

How are indices helping investors assess the growing range of thematic solutions? S&P DJI’s Ari Rajendra and BlackRock’s Jay Jacobs dive into the expanding landscape and the innovations and data helping investors at the leading edge of thematic trends.

The posts on this blog are opinions, not advice. Please read our Disclaimers.

Measuring Munis: Using Indices to Assess Yield Opportunities

How are muni indices helping market participants navigate the yield curve in the current climate? S&P DJI’s Jennifer Schnabl and Vanguard’s David Sharp take a closer look at the S&P Intermediate Term National AMT-Free Municipal Bond Index and S&P California AMT-Free Municipal Bond Index.

The posts on this blog are opinions, not advice. Please read our Disclaimers.

Commodities Deliver Double-Digit Returns in the Face of Stubborn Inflation

Contributor Image
Brian Luke

Senior Director, Head of Commodities, Real & Digital Assets

S&P Dow Jones Indices

Commodity markets remain on top of the asset class leader board with inflation drawing the ire of the Fed and other asset classes. The upside surprise in U.S. inflation spotlights the potential benefits of commodities as a diversification tool. The S&P GSCI, the leading indicator of broad commodity performance, has produced double-digit returns in 2024, currently up 12.8% following the uptick in consumer prices. Gold continues to reach all-time highs, surpassing USD 2,344 per troy ounce while cocoa is the best-performing commodity, nearly tripling over the past year. Both components are included in the S&P GSCI, helping produce a diversified exposure to the broad commodity market. For perspective, bitcoin has captured sizable flow into ETFs, and the S&P Bitcoin Index is “only” up 140%, less than half of what cocoa has done in the same period. The S&P GSCI has benefited from holding gold and cocoa, but oil is the largest component and has delivered the strongest historical sensitivity to inflation. The petroleum sector within the S&P GSCI is up 21.4% YTD, with precious metals up 13.2%. In this post, we review the last half century of commodity performance, which covers inflationary regimes and central bank responses.

Commodities have done well when inflation remains elevated, and the Federal Reserve maintains a defensive posture. Breaking inflation into low, medium and high inflationary environments, commodities have experienced double-digit annual gains when inflation exceeds 2%. The average one-year return when inflation measures between 2% and 4% is 13.3%. Exhibit 1 shows the breakdown by inflationary tiers.

Another way to measure commodity performance is when the Fed maintains a restrictive stance, defined by the Fed Funds Effective Rate exceeding target inflation of 2%. Again, going back the full history of the S&P GSCI to 1970, we measure the annualized returns during such periods and compare that with accommodative environments. The S&P GSCI achieved average annualized returns of 10.6% over the 39 years when the Fed Funds Effective rate was above 2%. This compares favorably to 0.9% average annualized returns during the 16 years the Fed held the effective rate below 2%. We recently covered this in a blog post, and updated the data through April in Exhibit 2.

A broad basket of commodities has historically helped provide diversification and inflation protection. Unlike traditional asset classes such as stocks and bonds, commodities have unique risk and return characteristics that are often uncorrelated with other investments. The S&P GSCI’s 10-year correlation to the S&P 500® is 0.4, while its correlation to the S&P GSCI Gold component is zero and it has a negative correlation of -0.16 to the S&P U.S. Aggregate Bond Index. Including commodities could help reduce overall volatility and enhance risk-adjusted returns by spreading risk across different asset classes. Additionally, commodities have historically exhibited a positive correlation with inflation, making them a possible hedge against rising prices. As prices for commodities tend to rise during inflationary periods, broad-based commodity indices like the S&P GSCI have demonstrated low correlation to other asset classes as well as positive performance correlation to persistent inflationary environments.

The posts on this blog are opinions, not advice. Please read our Disclaimers.

Meet the New and More Diversified S&P/BMV IPC

Contributor Image
Eduardo Olazabal

Associate Director, Global Exchange Indices

S&P Dow Jones Indices

S&P Dow Jones Indices launched a consultation in May 2023 proposing certain methodology changes to the S&P/BMV IPC with the overall goal of reducing single-stock concentration and simplifying rather complex eligibility and selection criteria.

After receiving feedback from market participants, a revised version of the proposal was approved in September 2023 and a two-phased implementation was announced starting with the March 2024 rebalance and concluding in June 2024 (see Exhibit 1 for a summary of the changes).

The main objective of these changes was to improve diversification by reducing stock concentration in the index. Exhibit 2 shows how the top five stocks represented about 53% of the index’s weight on average over the past five years and the impact of the first phase of the implementation during the March 2024 rebalance.

The decrease in concentration is achieved by reducing the weight caps for single stocks to 15% and the aggregate weight of the top five stocks to 45%. Additionally, a new rule to limit the weight of relatively illiquid stocks was introduced to address the potential for higher weightings of less liquid securities.

The additional changes in the eligibility and selection criteria were made in order to provide flexibility under different market conditions and to simplify the methodology.

Regarding the implementation, all changes except for the updated constituent weighting rules were implemented in full at the March 2024 rebalance. Changes to the constituent weighting caps will be implemented in two phases.

The first phase applied a 0.5 factor to the weight reduction of the capped stocks, with the resulting weight redistribution among the rest, for the March 2024 rebalance, with the intent of incorporating approximately half of the weight changes under the new rules (see Exhibit 3 for the new constituent weights in this first phase).

The final phase of implementation will be conducted at the June 2024 reweighting, where the changes in constituent weightings will go into full effect.

In summary, the methodology changes will contribute to improving diversification and flexibility in the S&P/BMV IPC, while at the same time, simplifying the methodology for the benefit of market participants.


The posts on this blog are opinions, not advice. Please read our Disclaimers.