Get Indexology® Blog updates via email.

In This List

S&P DJI’s Global Islamic Equity Benchmarks Rose 9% in the First Quarter, Extending Outperformance against Conventional Benchmarks

How Indexing Works for Model Portfolios

SPIVA Japan Scorecard 2023: Misfortune for Japanese Stock Pickers

Exploring the Growing Thematics Landscape

Measuring Munis: Using Indices to Assess Yield Opportunities

S&P DJI’s Global Islamic Equity Benchmarks Rose 9% in the First Quarter, Extending Outperformance against Conventional Benchmarks

Contributor Image
Sue Lee

Director and APAC Head of Index Investment Strategy

S&P Dow Jones Indices

Global equities had a strong start to the year as economic resilience and diminishing recession fears boosted risky assets overall. The S&P Global BMI surged 7.8% in the first quarter, led by developed markets; notably, the S&P 500® finished the quarter up 10.6%, at a new record high. Shariah-compliant global benchmarks beat their conventional counterparts, with the S&P Global BMI Shariah and Dow Jones Islamic Market (DJIM) World Index generating an outperformance of 0.8% and 0.6%, respectively, during the quarter. The DJIM World Emerging Markets Index was a laggard, trailing behind the conventional benchmark as well as the developed market counterpart (see Exhibit 1).

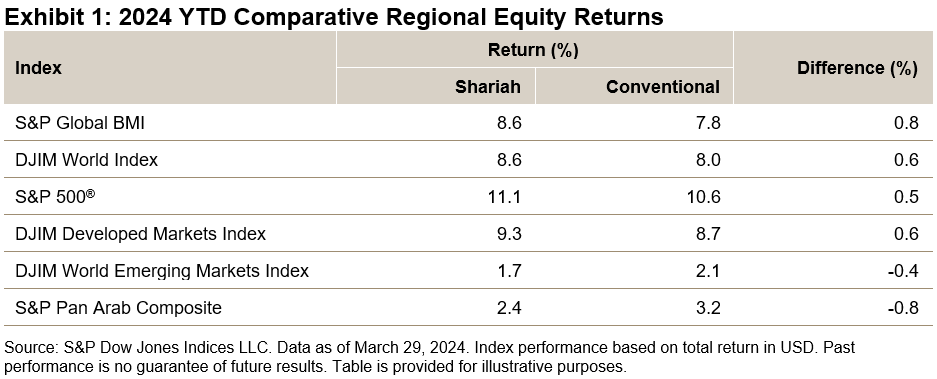
MENA equities lagged along with emerging markets, with the S&P Pan Arab Composite posting a modest gain of 3.2%. Egypt was among the worst performers, with the S&P Egypt BMI falling 27.4% in U.S. dollar terms. The Egyptian pound shed over one-third of its value against the U.S. dollar during the quarter, as the country agreed on a USD 8 billion support program with the International Monetary Fund and let go of control on its currency in a bid for economic stability. GCC countries largely posted gains led by Kuwait (8.1%) and Bahrain (8.0%), while Qatar was an exception, with a 3.3% loss.

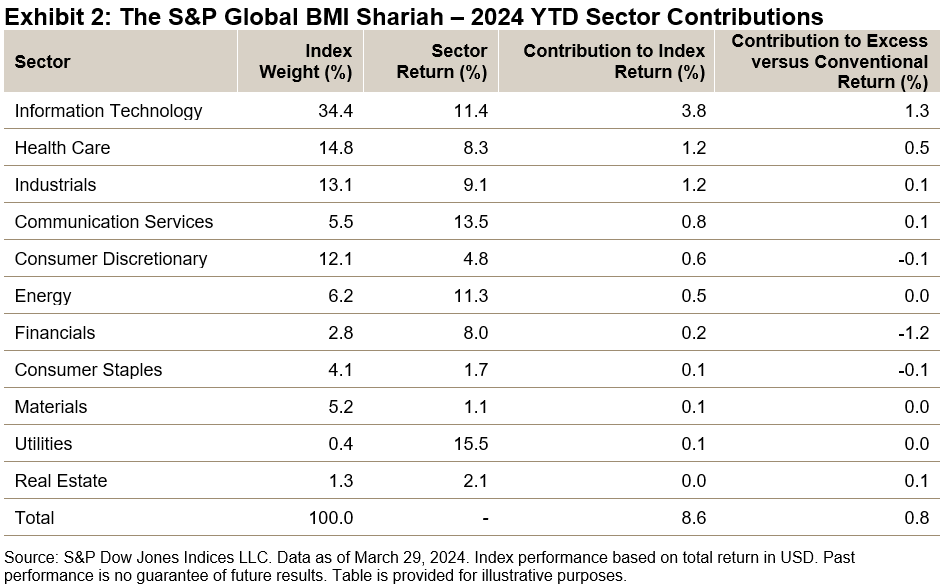
Drivers of Shariah Index Performance in Q1 2024

All sectors contributed positively to the S&P Global BMI Shariah in the first quarter. Extending the trend in 2023, Information Technology continued to be the largest contributor, accounting for 44% of the index return and generating an excess return of 1.3% versus the conventional benchmark. On the other hand, Financials contributed most negatively to the relative performance, with an excess return of -1.2%, due to its lower weightings as compared to the conventional benchmark (see Exhibit 2).

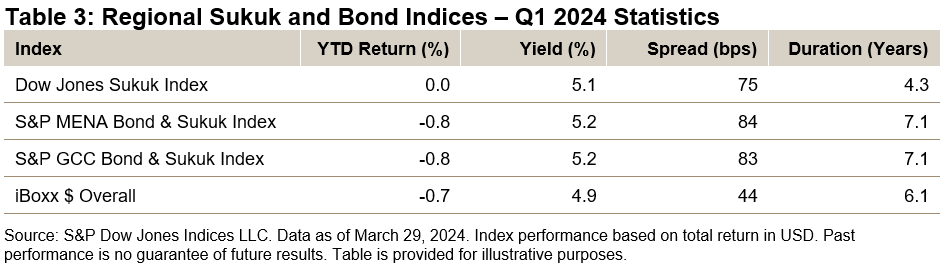
Global Sukuk Fared Better than Bonds in Q1 2024

The Sukuk market was largely muted, with a close-to-zero gain in the first quarter as measured by the Dow Jones Sukuk Index. The benchmark outperformed the regional MENA and GCC Bond & Sukuk benchmarks as well as the global iBoxx USD Overall, as shorter-dated securities generally outperformed longer-dated ones during the quarter.

This article was first published in IFN Volume 21 Issue 16 dated April 17, 2024.

The posts on this blog are opinions, not advice. Please read our Disclaimers.

How Indexing Works for Model Portfolios

What’s the role of indices in constructing and evaluating model portfolios? S&P DJI’s Joseph Nelesen and BlackRock’s Elise Terry explore how indexing is changing the landscape for advisors and their clients and helping a range of market participants build and assess models across the asset class spectrum.

The posts on this blog are opinions, not advice. Please read our Disclaimers.

SPIVA Japan Scorecard 2023: Misfortune for Japanese Stock Pickers

Contributor Image
Sue Lee

Director and APAC Head of Index Investment Strategy

S&P Dow Jones Indices

Since the first publication of the S&P Indices Versus Active (SPIVA®) U.S. Scorecard in 2002, S&P Dow Jones Indices has regularly reported on the relative performance of actively managed funds versus benchmark indices across an increasing number of global fund markets and fund categories.1

The SPIVA Japan Scorecard has been tracking the performance of active funds offered in Japan since 2014, covering large-, mid- and small-cap segments, as well as international and global equity funds. Over these years, we found that a significant majority of active funds in Japan underperformed their assigned benchmark in each of our reported fund categories. Exhibit 1 summarizes the underperformance rate of active funds in Japan over the 1-, 3-, 5- and 10-year periods ending on Dec. 31, 2023, across different fund categories.

While 2023 marked an epic turnaround for Japanese equities with a reprieve from long-suffering deflation, it was a challenging year for Japanese active managers. 78% of Japanese domestic equity funds (All Japan Equity category) underperformed the broad-based S&P Japan 500 over the full year 2023. Furthermore, over two-thirds of equity funds underperformed their benchmarks in every reported category, posting underperformance rates worse than their 10-year averages in nearly all categories except for the U.S. Equity (see Exhibit 2).

What could explain last year’s misfortune of Japanese active fund managers? Among many possible explanations, we found three market conditions that posed challenges for active managers.

  1. Large-cap outperformance: The outperformance of large-cap companies was one of the key market trends in 2023. This was well publicized in the U.S. market with the so-called “Magnificent Seven,” namely Apple, Amazon, Alphabet, Meta, Microsoft, Nvidia and Tesla, which contributed 58% of the S&P 500®’s return in 2023. Similarly in Japan, the large-cap S&P/TOPIX 150 outperformed the S&P Japan MidSmallCap by 4% in 2023, resulting in increased market concentration (see Exhibit 3). This environment would have worked against active managers who searched for a source of outperformance among smaller, lesser-known names.
  2. Falling dispersion: Dispersion,2 the degree to which stocks differ from the average performance, measures the opportunity set for active managers to outperform through stock selection. Dispersion moved lower globally in 2023, though it remained elevated relative to its history (see Exhibit 4), which points to reduced opportunities for active managers overall.
  3. Return distribution: Stating the obvious, when fewer stocks outperform the benchmark, it becomes less likely for managers to find them. In 2023, the percentage of constituents outperforming their benchmark fell well below 50% across domestic and global benchmarks amid a strong market rally. In Japan, the percentage of constituents outperforming the S&P 500 Japan dropped from 58% in 2022 to 44% in 2023 (see Exhibit 5).

To learn more, we invite you to explore the results of our SPIVA Japan Year-End 2023.

1 See SPIVA Around the World and SPIVA Fixed Income Around the World for the latest results of equity and fixed income funds across all covered markets.

2 See Tim Edwards and Craig J. Lazzara, “Dispersion: Measuring Market Opportunity,” S&P Dow Jones Indices LLC, 2014


The posts on this blog are opinions, not advice. Please read our Disclaimers.

Exploring the Growing Thematics Landscape

How are indices helping investors assess the growing range of thematic solutions? S&P DJI’s Ari Rajendra and BlackRock’s Jay Jacobs dive into the expanding landscape and the innovations and data helping investors at the leading edge of thematic trends.

The posts on this blog are opinions, not advice. Please read our Disclaimers.

Measuring Munis: Using Indices to Assess Yield Opportunities

How are muni indices helping market participants navigate the yield curve in the current climate? S&P DJI’s Jennifer Schnabl and Vanguard’s David Sharp take a closer look at the S&P Intermediate Term National AMT-Free Municipal Bond Index and S&P California AMT-Free Municipal Bond Index.

The posts on this blog are opinions, not advice. Please read our Disclaimers.