


What’s the relevance of U.S. sectors globally in the current landscape? Join S&P DJI’s Hamish Preston and State Street Investment Management’s Matt Bartolini as they explore the Select Sector Indices and how they are helping market participants evaluate and express sector views across evolving market conditions.
The posts on this blog are opinions, not advice. Please read our Disclaimers.Using Select Sectors to Evaluate Opportunities and Risks
Indexing Modern Income: Covered Calls Uncovered
S&P 500 Catholic Values Index: 10 Years and Counting – Part 1
Introducing the S&P MERVAL Index (MEP): A Local USD View of Argentina’s Equity Market
2025: A Market for Stock Pickers in France?
Using Select Sectors to Evaluate Opportunities and Risks
- Categories Equities
- Tags GICS, S&P 500 Sectors, Select Sector Indices, Select Sectors, U.S. sectors, US FA
Indexing Modern Income: Covered Calls Uncovered

Capital markets offer several primary sources of income to investors, including money market interest, bond coupons and stock dividends. Alternative sources of income abound and, most recently, innovation within the exchange-traded fund (ETF) industry has introduced options-based income strategies to a wider range of market participants.
In the U.S., investors both large and small have long used options markets to generate income, either by trading options directly or indirectly through structured products.1 In more recent years, options-based ETFs have also found popularity, as a range of strategies collectively known as “covered call” (or “buy-write”) strategies are increasingly used to generate income, dampen volatility and enhance risk-adjusted performance in certain market regimes. So, how do they work, and what is their role in generating income?
What Does a Covered Call Really Do?
A covered call strategy combines:
- An investment in an asset (e.g., a portfolio tracking the S&P 500®); and
- The sale (writing) of a call option on the same (or correlated) asset.
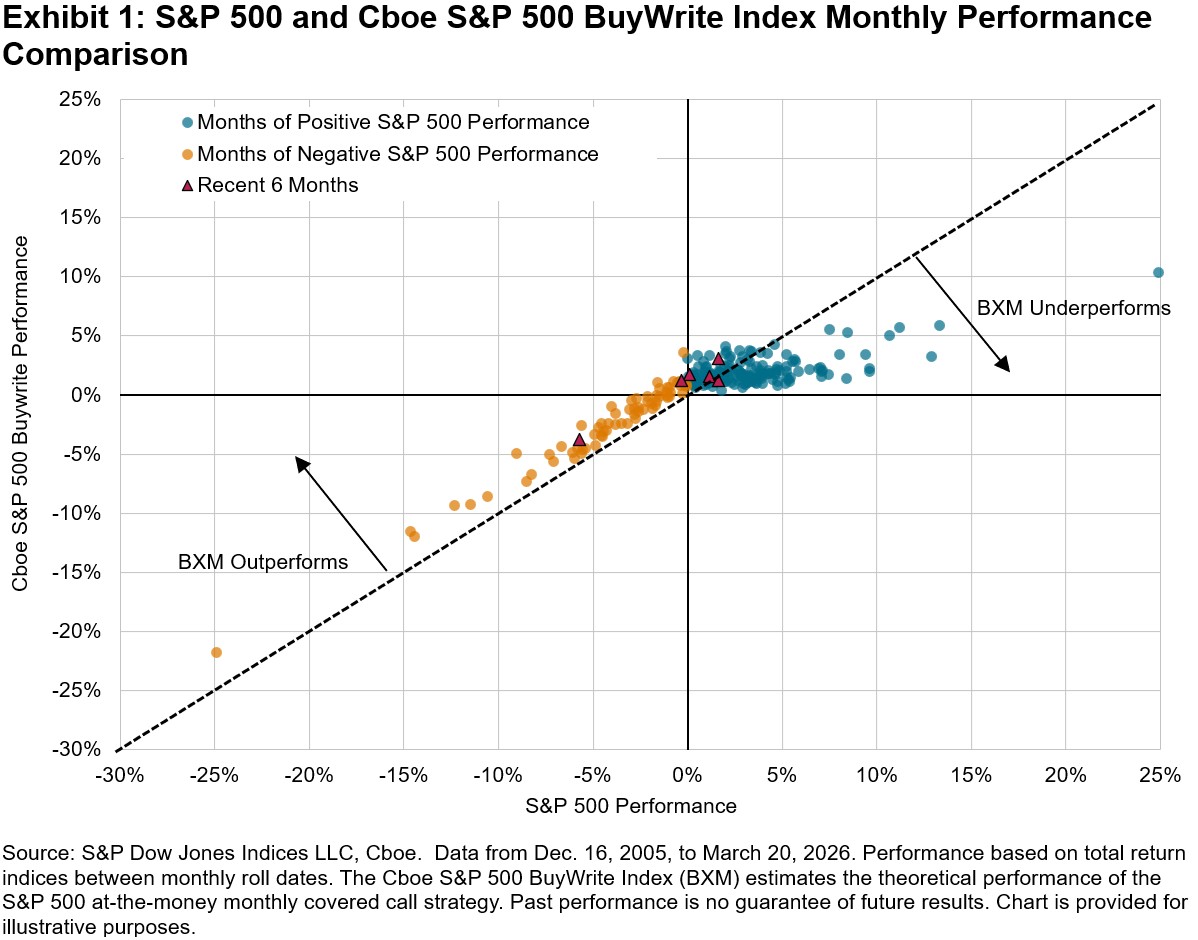
By selling call options, the investor receives an upfront premium, and any amounts owed on the call option (occurring if the underlying asset rises above the strike price) are “covered” by the profits of the first investment. The regular repeat of such sales can provide a relatively steady income stream, with the natural trade-off that the investor will not simultaneously benefit fully from price gains in the asset, since all or a portion of those gains are offset by losses on the sold options.
Simply put, covered call strategies exchange some upside potential for option premium income, narrowing the range of outcomes. This trade-off is illustrated through the monthly performance comparison of the S&P 500 at-the-money monthly covered call strategy—as measured by the Cboe S&P 500 BuyWrite Index (BXM)—versus the S&P 500 over a 20-year period (see Exhibit 1).2 For example, over the recent six monthly rolls between Sept. 19, 2025, and March 20, 2026, the BXM’s monthly performance ranged between -3.8% to 3.1% compared to the S&P 500’s range between -5.0% and 2.5%, with the former outperforming in five out of six months.
Why Covered Calls?
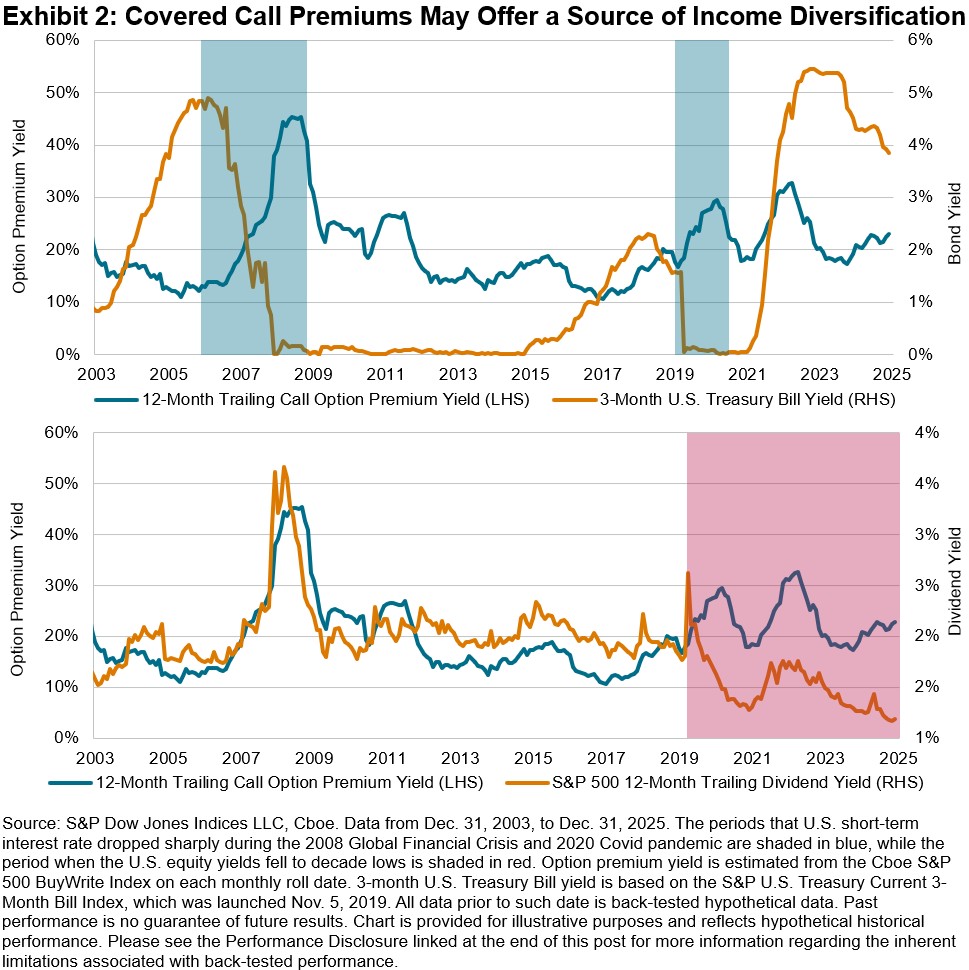
The appeal of covered calls extends beyond simple income generation and volatility reduction. Option premiums can provide a distinct income stream that is less correlated with traditional sources such as bonds and dividends. Bond income is sensitive to interest rate policy, and dividend income can be reduced during economic downturns (while dividend yields tend to be driven more by price effects).
Option premiums, by contrast, are primarily driven by market volatility.3 When markets sell off, volatility typically rises, leading to higher option premiums. This was evident during the 2008 Global Financial Crisis and the 2020 COVID-19 pandemic (periods shaded in blue in Exhibit 2), when interest rates fell toward zero but increased volatility boosted option income. Notably, option premiums have also remained relatively elevated in recent years, even as dividend yields declined to decade lows (the period shaded in red in Exhibit 2).
Covered calls have historically helped support portfolio income when other sources were under pressure, making them a valuable tool for building resilient income.
Design Matters: Variations and Implementation
There are many possible variations of covered call strategies across different maturities and strike prices, and outcomes can vary materially depending on the design of the strategy. The S&P 500’s deep and robust derivatives ecosystem enables effective implementations of various strategies, catering to changing market environments and investor needs. It is important to carefully assess each component of the strategy, for both product issuers and investors, to find the optimal approach that can help achieve desired outcomes.
For a deeper dive into the index-based framework of covered call strategies, see “Defining Paths with Options-Based Index Strategies.”
1 According to SRP, the U.S. structured notes market reached USD 150 billion in 2024, up 46% from the previous year.
2 For details on the index construction, see the BXM index methodology.
3 Options market often exhibits a “volatility premium”—a tendency for implied volatility (the level of volatility reflected in option prices) to exceed the actual volatility that occurs. This phenomenon is largely driven by supply and demand imbalances in the options market (see Defining Paths with Options-Based Index Strategies for more details). Covered call strategies seek to harvest this volatility premium by regularly selling call options, aiming to profit from the persistent gap between market expectations and realized outcomes.
The posts on this blog are opinions, not advice. Please read our Disclaimers.S&P 500 Catholic Values Index: 10 Years and Counting – Part 1

Maria Sanchez
Director, Sustainability Index Product Management, U.S. Equity Indices
S&P Dow Jones Indices
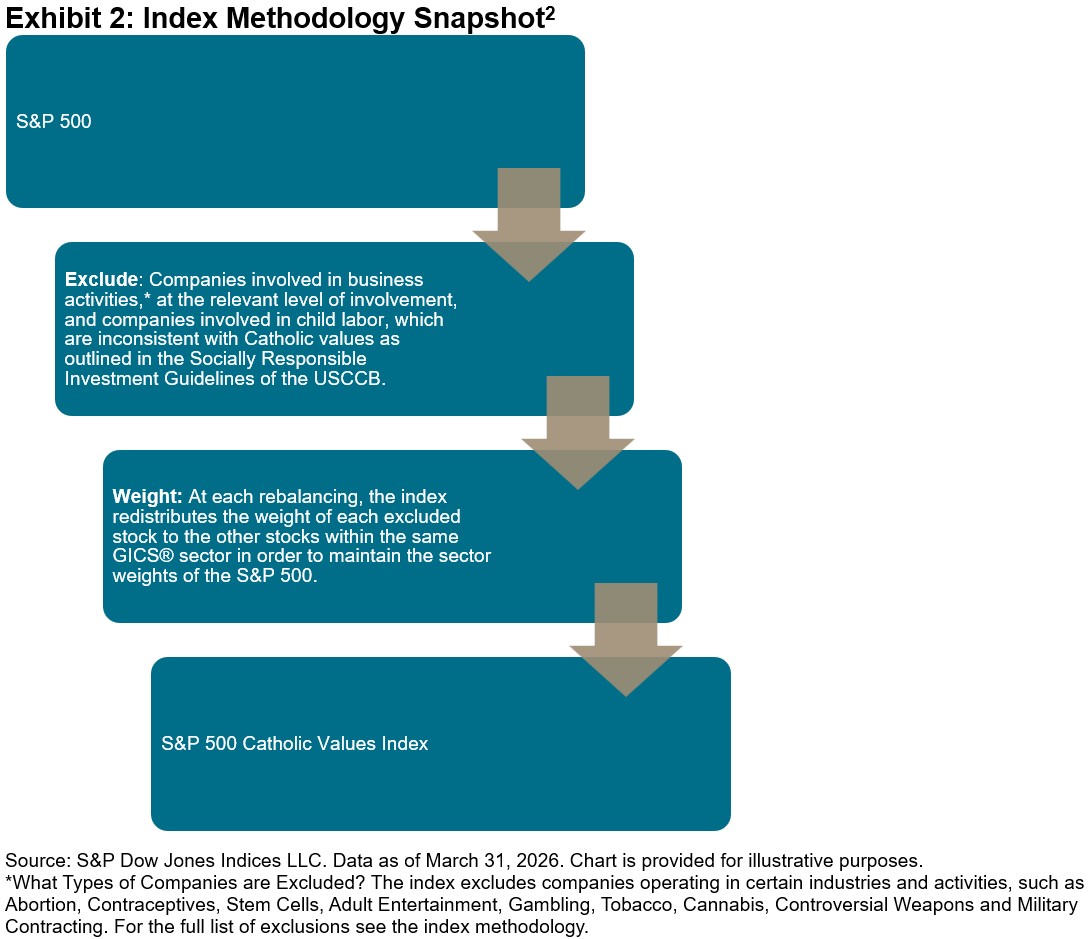
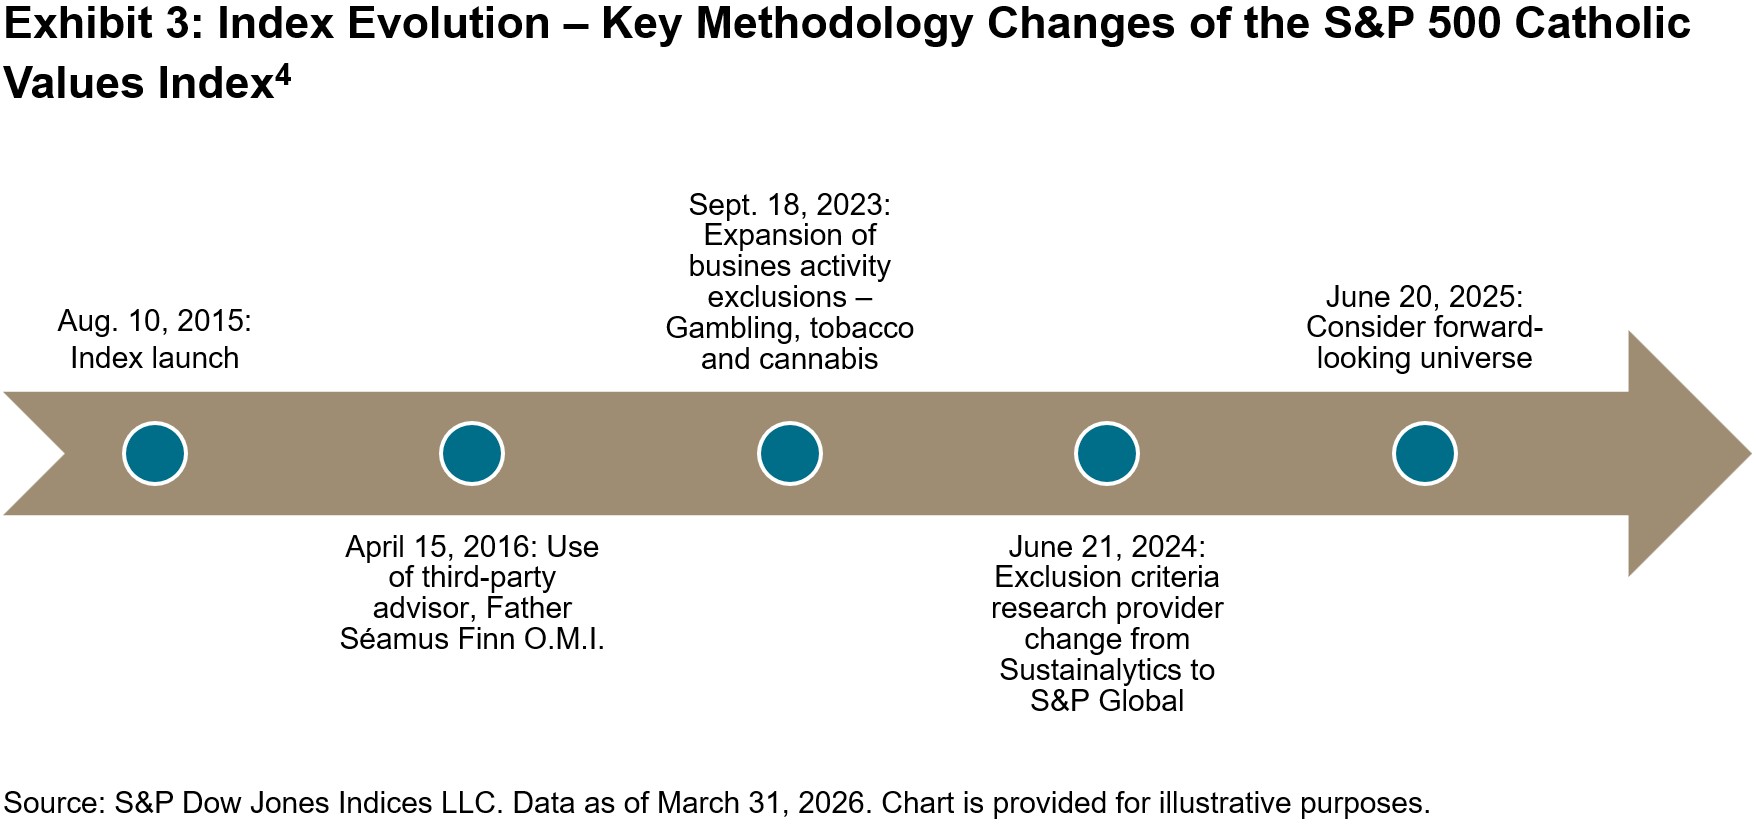
For over a decade, the S&P 500® Catholic Values Index has served as a rules-based tool to help market participants that seek to align their investments with their values. The index was officially launched on Aug. 10, 2015, and excludes companies involved in activities inconsistent with the Socially Responsible Investment Guidelines of the U.S. Conference of Catholic Bishops (USCCB).1
To ensure ongoing adherence to these guidelines, S&P Dow Jones Indices consults with Father Séamus Finn O.M.I., Chief of Faith Consistent Investing at the Oblate International Pastoral Investment Trust, regarding the consistency of the S&P 500 Catholic Values Index methodology with USCCB standards.
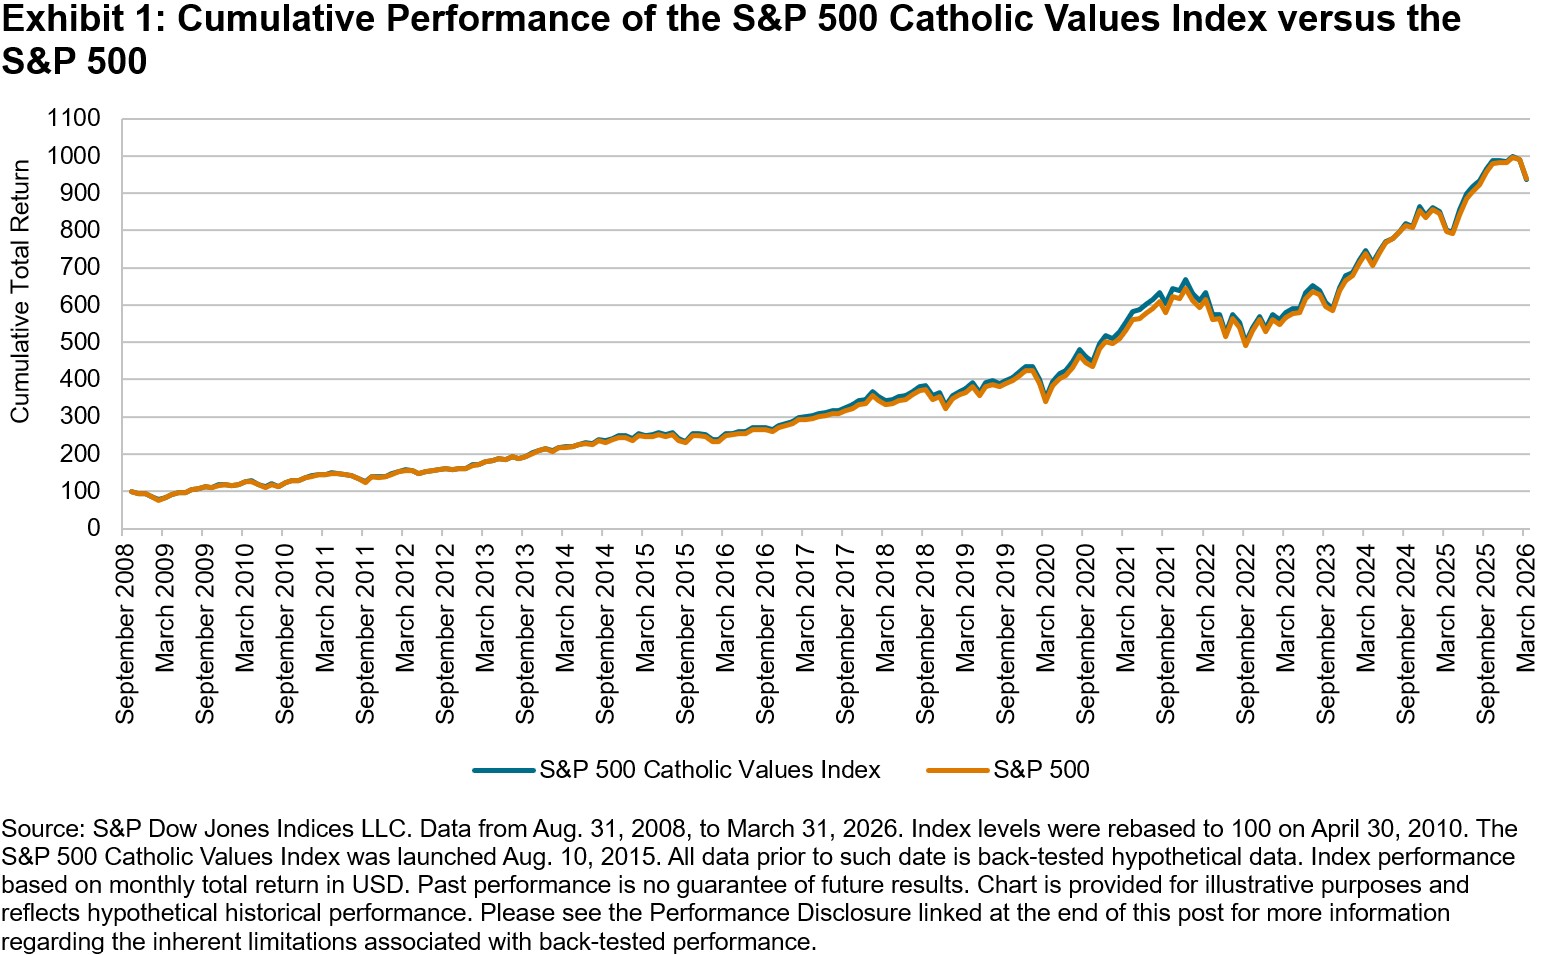
As shown in Exhibit 1, the performance of the S&P 500 Catholic Values Index has closely tracked that of its benchmark, the S&P 500, reflecting its broad market coverage. However, it is intentionally not identical, as its methodology (summarized in Exhibit 2) applies specific values-based exclusions that differentiate its composition.
The index’s evolution reflects S&P DJI’s continuous methodology monitoring, including the 2023 expansion of exclusions for companies with business activities in gambling, tobacco and cannabis—ensuring alignment with the updated USCCB guidelines. In addition to updates in guidelines and best practices, the methodology has also evolved to leverage improved data, enabling a more efficient implementation of the USCCB guidelines, and it has been refined to minimize deviations from the S&P 500 by adjusting rebalancing schedules and incorporating a forward-looking universe.3
The 10th anniversary of the S&P 500 Catholic Values Index marks a significant milestone in the evolution of values-based indexing. Its ongoing evolution underscores the index’s capacity to balance values alignment with broad market coverage, reinforcing its relevance for those seeking to integrate faith-based principles into their investment approach.
1 Socially Responsible Investment Guidelines 2021
2 For the full list of exclusions, see the index methodology.
3 S&P Catholic Values Indices Rebalancing Methodology Update.
4 For the full list of changes, see the index methodology.
The posts on this blog are opinions, not advice. Please read our Disclaimers.Introducing the S&P MERVAL Index (MEP): A Local USD View of Argentina’s Equity Market

The S&P MERVAL Index is Argentina’s flagship equity index and the main reference used by market participants to measure the performance of that market. However, in a high-inflation environment, Argentine peso returns can become distorted, so investors often look at returns in U.S. dollars. This raises an important question: in a market with high inflation and multiple exchange rates, which foreign exchange (FX) reference best reflects “real” USD performance?
To add a widely used FX conversion lens for Argentina equities, S&P Dow Jones Indices launched the S&P MERVAL Index (MEP), which complements the existing S&P MERVAL Index (ARS) by converting gains using the Mercado Electrónico de Pagos (MEP) exchange rate, a key reference in local financial markets.
Understanding Argentina’s Multiple FX Rates: Why USD Performance Can Differ
Argentina has long operated with multiple FX rates shaped by regulation, access conditions and market pricing. As a result, converting an equity index from ARS to USD isn’t universal, but rather depends on the FX reference used.
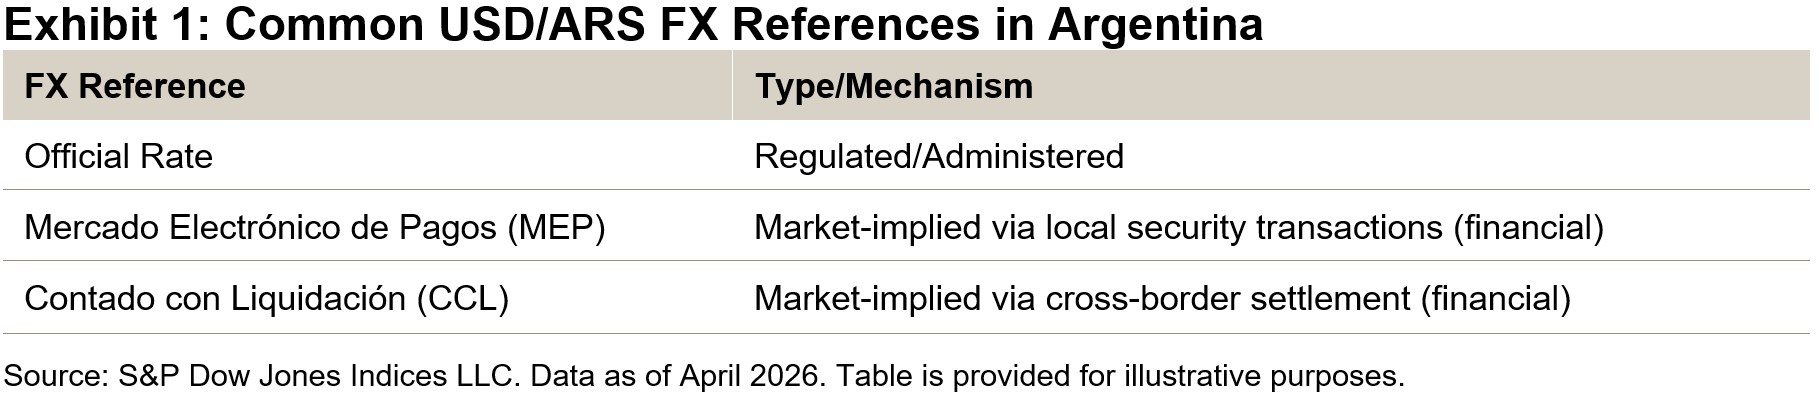
Broadly, FX rates tend to fall into two groups:
- Official/regulated rates: Set or constrained by policy and eligibility rules; and
- Financial/market-implied rates: Derived from prices of locally traded securities.
The MEP rate is a market-implied financial FX rate, typically inferred by buying a security in pesos and selling the same (or equivalent) security locally in U.S. dollars. Because it comes from traded prices, it can diverge, sometimes materially, from official rates.
Why Launch the S&P MERVAL Index (MEP) and What’s Different versus the S&P MERVAL Index (USD)?
The S&P MERVAL Index (MEP) was launched to provide a version of the S&P MERVAL Index that uses a USD/ARS exchange rate derived from local market pricing. This differs from the existing S&P MERVAL (USD) series, which uses the WMR FX rate (calculated by Reuters/LSEG).
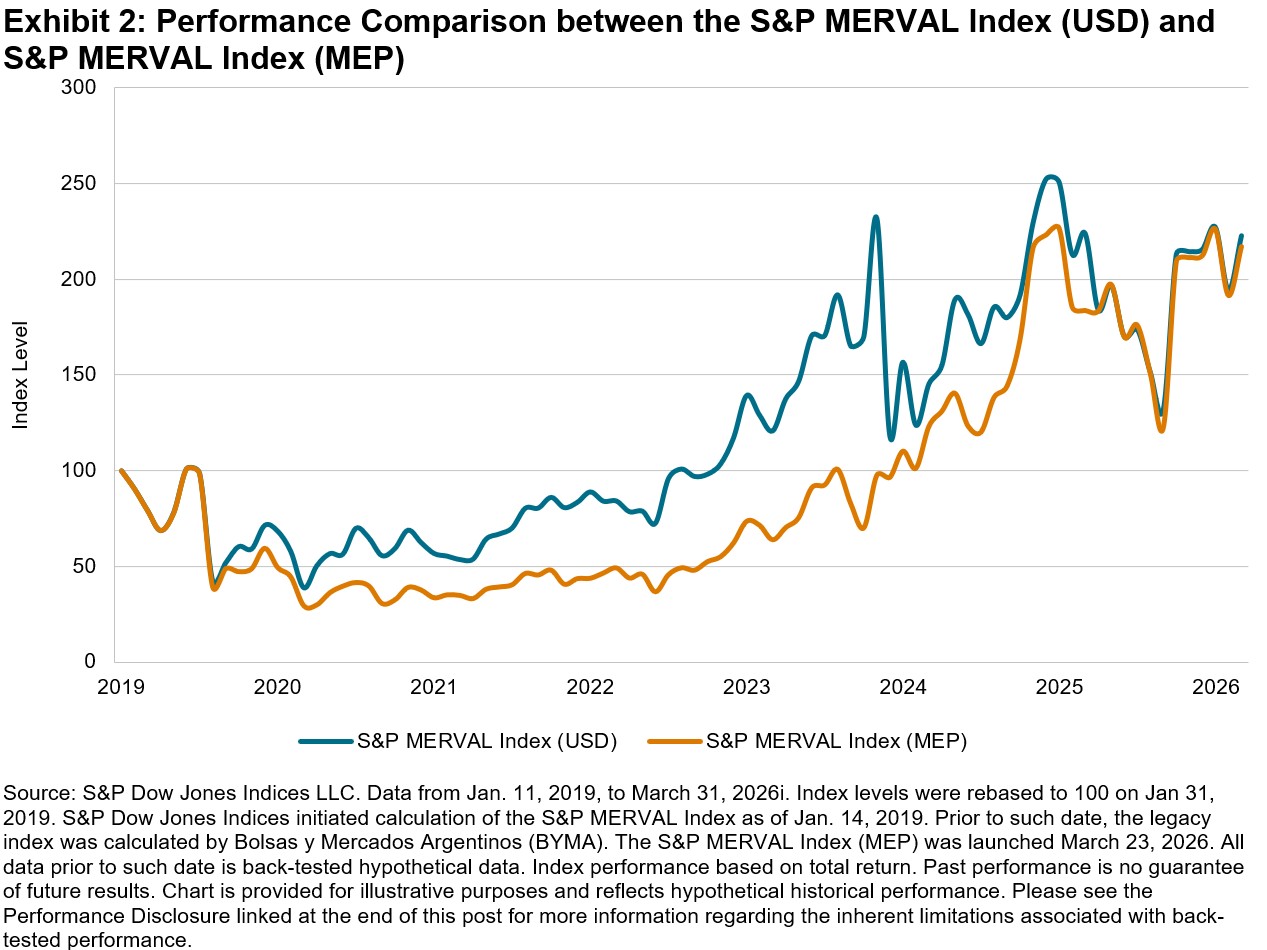
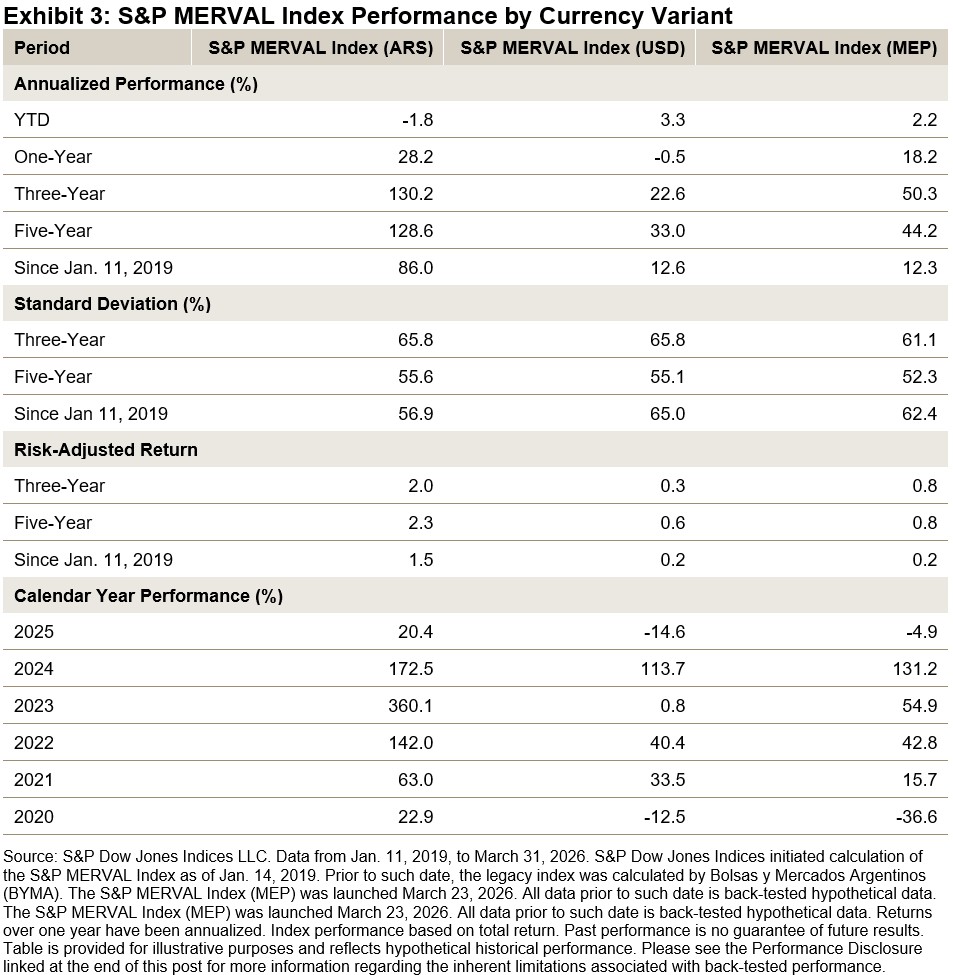
Exhibits 2 and 3 demonstrate that the choice of conversion mechanism can materially affect observed USD outcomes, particularly over intermediate and long-term horizons. Recent regulatory changes have increased flexibility in currency conversion, causing the official rate and MEP rate to converge over the past year. However, longer-term performance differences remain significant. For example, one-year performance differed substantially: -0.5% for the S&P MERVAL Index (USD) versus 18.2% for the S&P MERVAL Index (MEP). Similarly, annualized performance diverged over longer periods, with three-year gains of 22.6% for the S&P MERVAL Index (USD) versus 50.3% for the S&P MERVAL Index (MEP), and five-year gains of 33.0% versus 44.2%, respectively.
Conclusion
The launch of the S&P MERVAL Index (MEP) expands the toolkit for analyzing Argentine equities by recognizing that, in a multi-rate FX environment, USD performance depends on the FX reference used. By pairing the existing USD series with a MEP-based version and viewing both alongside the ARS version, it’s possible to more clearly separate equity market moves from currency and inflation translation effects.
The posts on this blog are opinions, not advice. Please read our Disclaimers.2025: A Market for Stock Pickers in France?

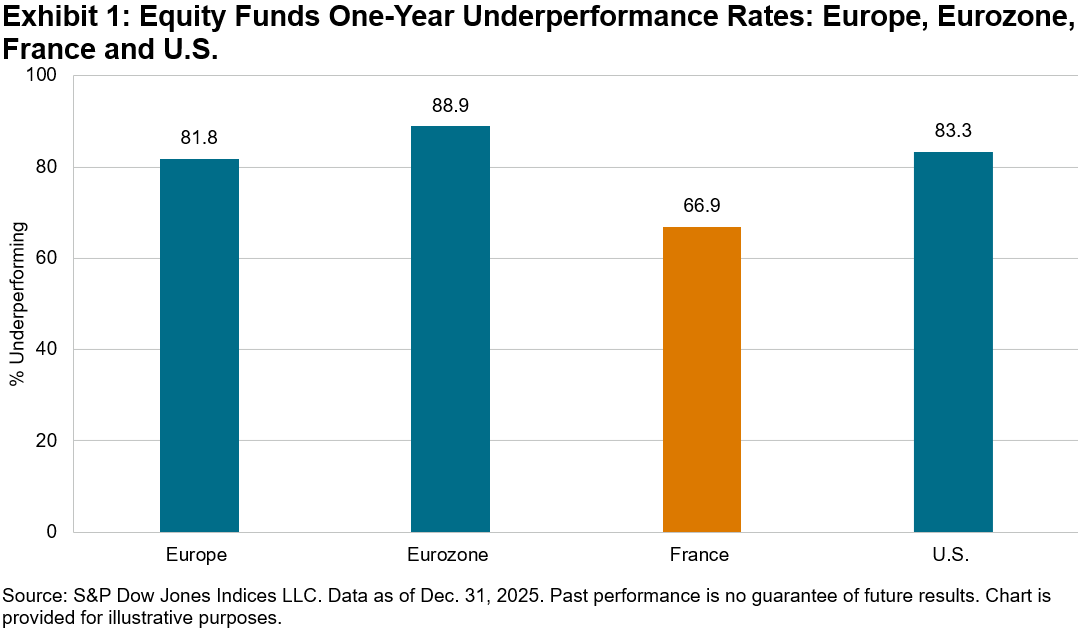
Despite a strong year for global equities in 2025, most active funds in Europe struggled to outperform their benchmarks. According to the latest SPIVA® Europe Year-End 2025 Scorecard, 81.8% of active equity funds lagged their benchmarks over the past year, rising to 97.0% over the 10-year period.1 The France Equity fund category offered a notable exception, with a lower one-year underperformance rate of only 66.9% (see Exhibit 1).
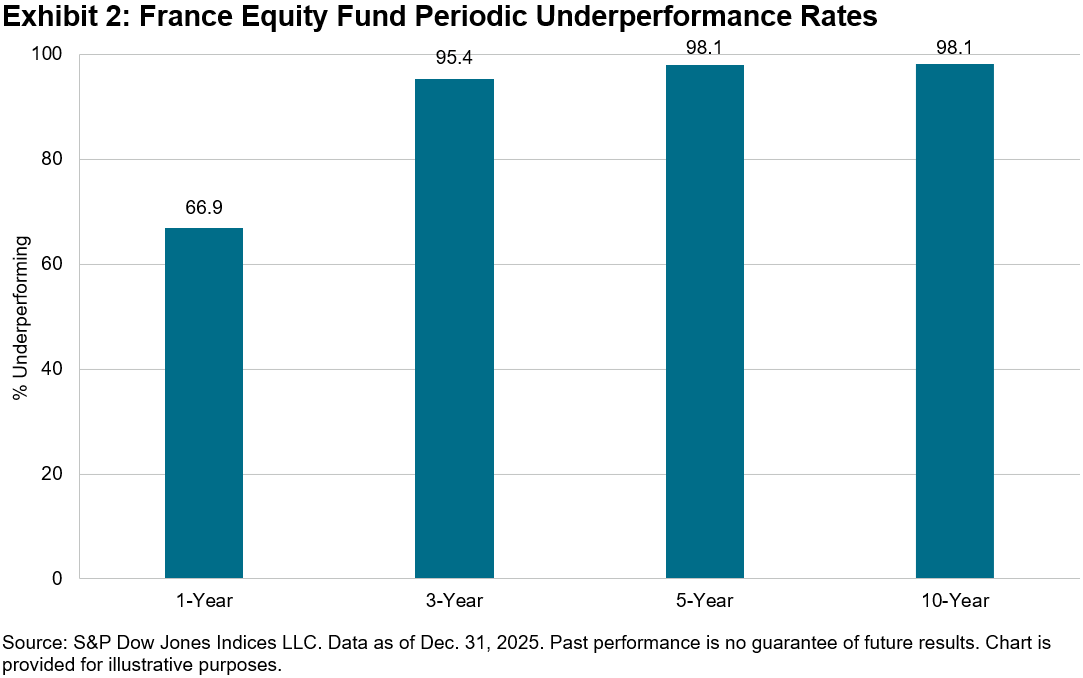
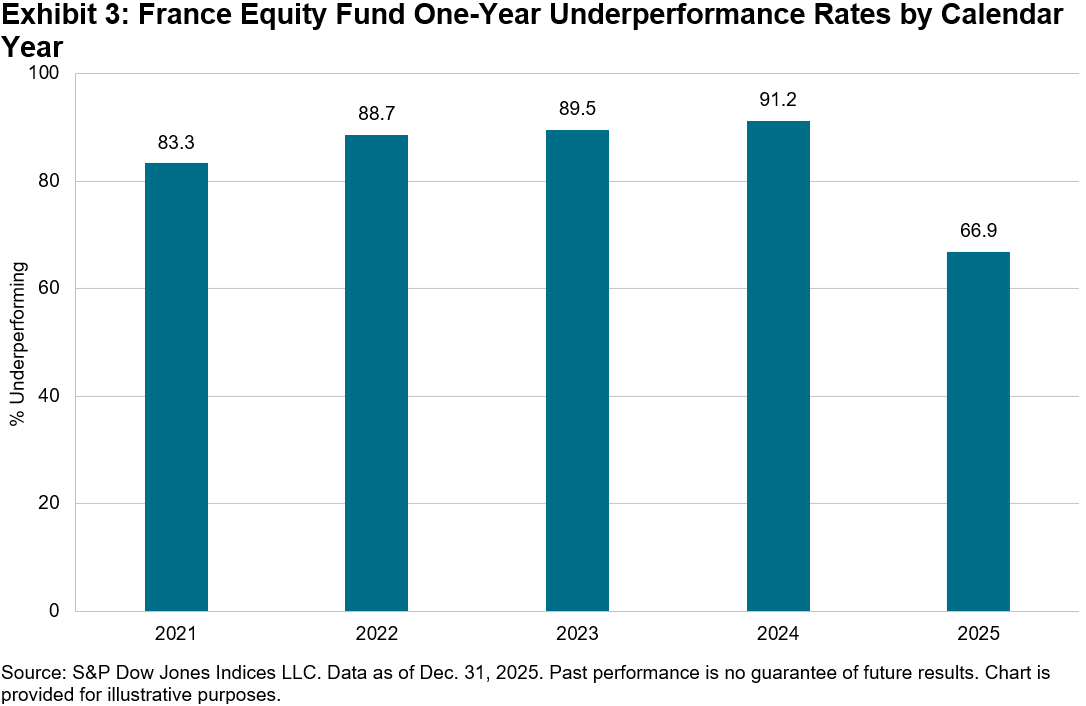
This lower one-year underperformance rate marked a significant improvement compared to recent years. Over the past four years, an average of 88.2% of France Equity funds underperformed on a one-year basis, with the rate declining by almost 20 percentage points in 2025. However, this short-term gain was not sustained; over the 3-, 5- and 10-year periods, the performance of France Equity funds aligned with European averages. Both the longer-term convergence and short-term advance are shown in Exhibits 2 and 3.
To understand why France’s equity market appeared relatively easier for active funds to navigate in 2025, it helps to start with what performance the benchmark delivered and what its underlying drivers were. In 2025, the flagship S&P France BMI increased by 14.4%. In comparison, the S&P 500® rose 3.9%, while the S&P Europe 350® posted its strongest performance in four years, with a 20.5% gain. The more geographically focused S&P Eurozone BMI outperformed them all, climbing 25.0%.
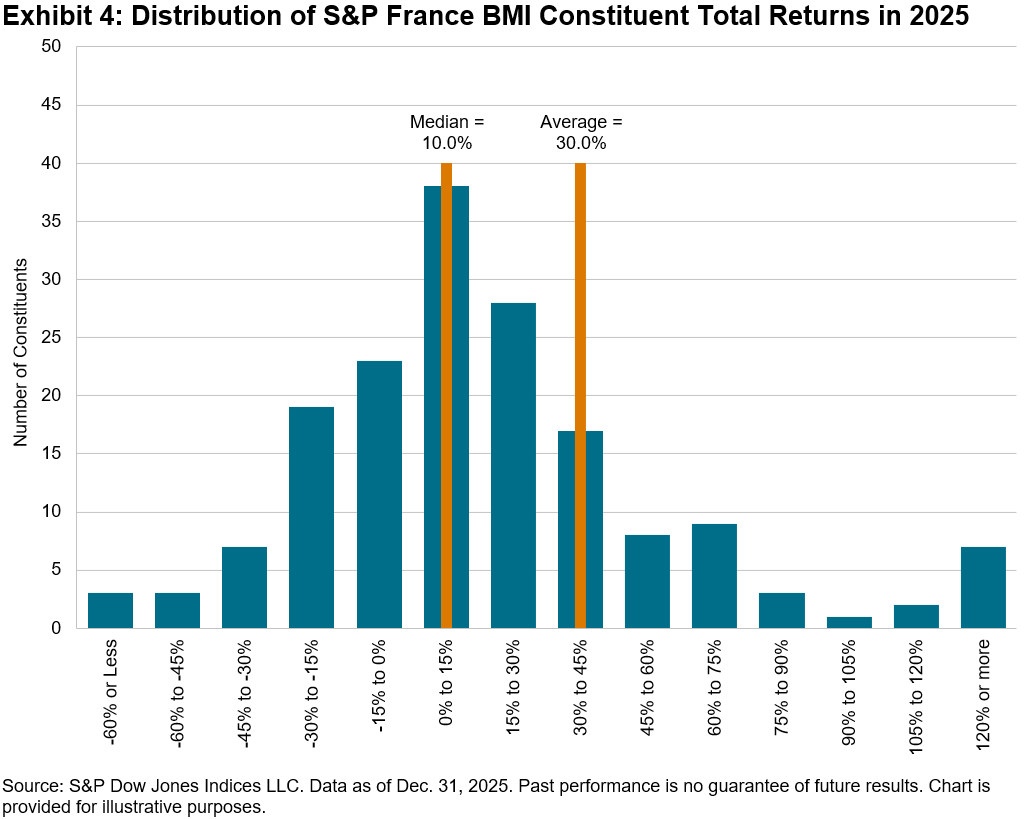
In 2025, leadership within the S&P France BMI extended beyond just its largest constituents. Skewness was quite elevated; while the average constituent gained 30.0%, the median increase was only 10.0%, and fewer than half (45.8%) of stocks outperformed the index (see Exhibit 4). This wide dispersion created more opportunities for stock selection, which may explain the lower rate of active underperformance. However, it also underscores the persistent challenges active managers face in beating the benchmark. Managers who identified strong performers outside the top holdings had a better chance of keeping pace.
So, are we finally catching a hint of the long-awaited “stock-pickers’ market,” or is it still just beyond reach for most?
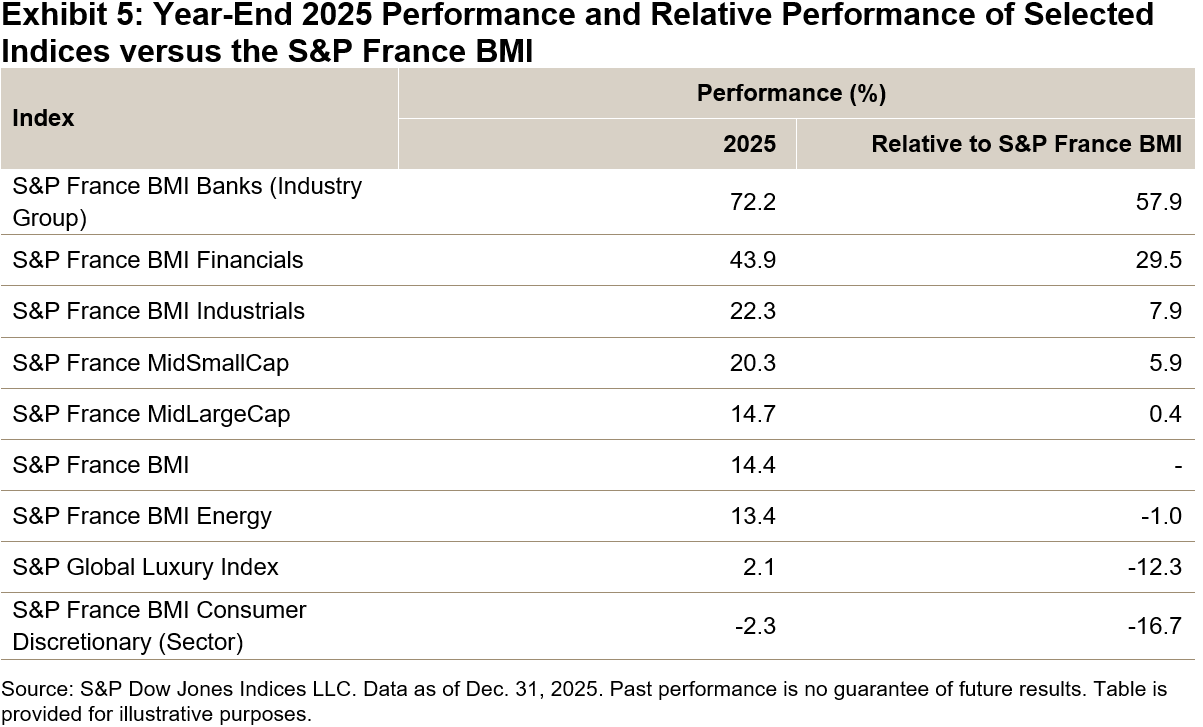
Sector effects appeared to play an important role in performance last year. Industrials and Financials accounted for around three-quarters of the S&P France BMI’s total gains in 2025. Financials showed strong results, with the S&P France BMI Financials sector rising 43.9%. Within Financials, the Banks industry group stood out, as the S&P France BMI Banks increased 72.2% in 2025, 57.9% above the broader S&P France BMI, as illustrated in Exhibit 5. The French bank Société Générale was among the year’s top-performing European banks. For active managers, being structurally underweight in either sector may have presented a meaningful headwind, even if stock selection was effective. The bigger risk may not have been picking the wrong banks but not enough banks.
When looking into some of the key stocks commonly held among active France Equity funds, another leg of France’s “luxury slump” may have negatively affected many managers. Large names like LVMH and Hermès, which historically have often led the pack, posted muted or even negative returns. Managers who stuck with these legacy luxury stocks probably felt the drag on performance.
The S&P France BMI Consumer Discretionary (Sector) fell 2.3%, finishing the year 16.7% behind the benchmark (see Exhibit 5). Within the S&P France BMI, the Apparel, Accessories & Luxury Goods sub-industry had the highest weight, at 12.8%, but only managed a 1.9% gain, contributing just 0.3% to the index’s total performance. That divergence—banks surging while luxury lagged—helped widen the gap between “right sector” and “wrong sector” positioning.
2025 marked a relatively bright spot for French active managers, with fewer underperforming their benchmark compared to the European average, though most still lagged behind. Whether this was truly “The Year of Stock Picking in France” remains to be seen; stay tuned for our SPIVA Europe Mid-Year 2026 Scorecard to find out if this momentum continued or proved to be a one-off.
1 SPIVA compares net-of-fees active fund returns with category-appropriate benchmarks and corrects for survivorship bias.
The posts on this blog are opinions, not advice. Please read our Disclaimers.