Get Indexology® Blog updates via email.

In This List

The Evolution of Fixed Income Indexing: A Look over 25 Years

The Kingdom's Edge: Finding Asymmetry and Growth in Saudi Equities

The S&P 500 Catholic Values Index: 10 Years and Counting - Part 2

The Significance of Select Sectors to APAC

Using Select Sectors to Evaluate Opportunities and Risks

The Evolution of Fixed Income Indexing: A Look over 25 Years

Contributor Image
Hannah Abrams

Analyst, Fixed Income Product Management

S&P Dow Jones Indices

Over the past 25 years, the iBoxx EUR indices have evolved alongside the market they were built to measure (see Exhibit 1).

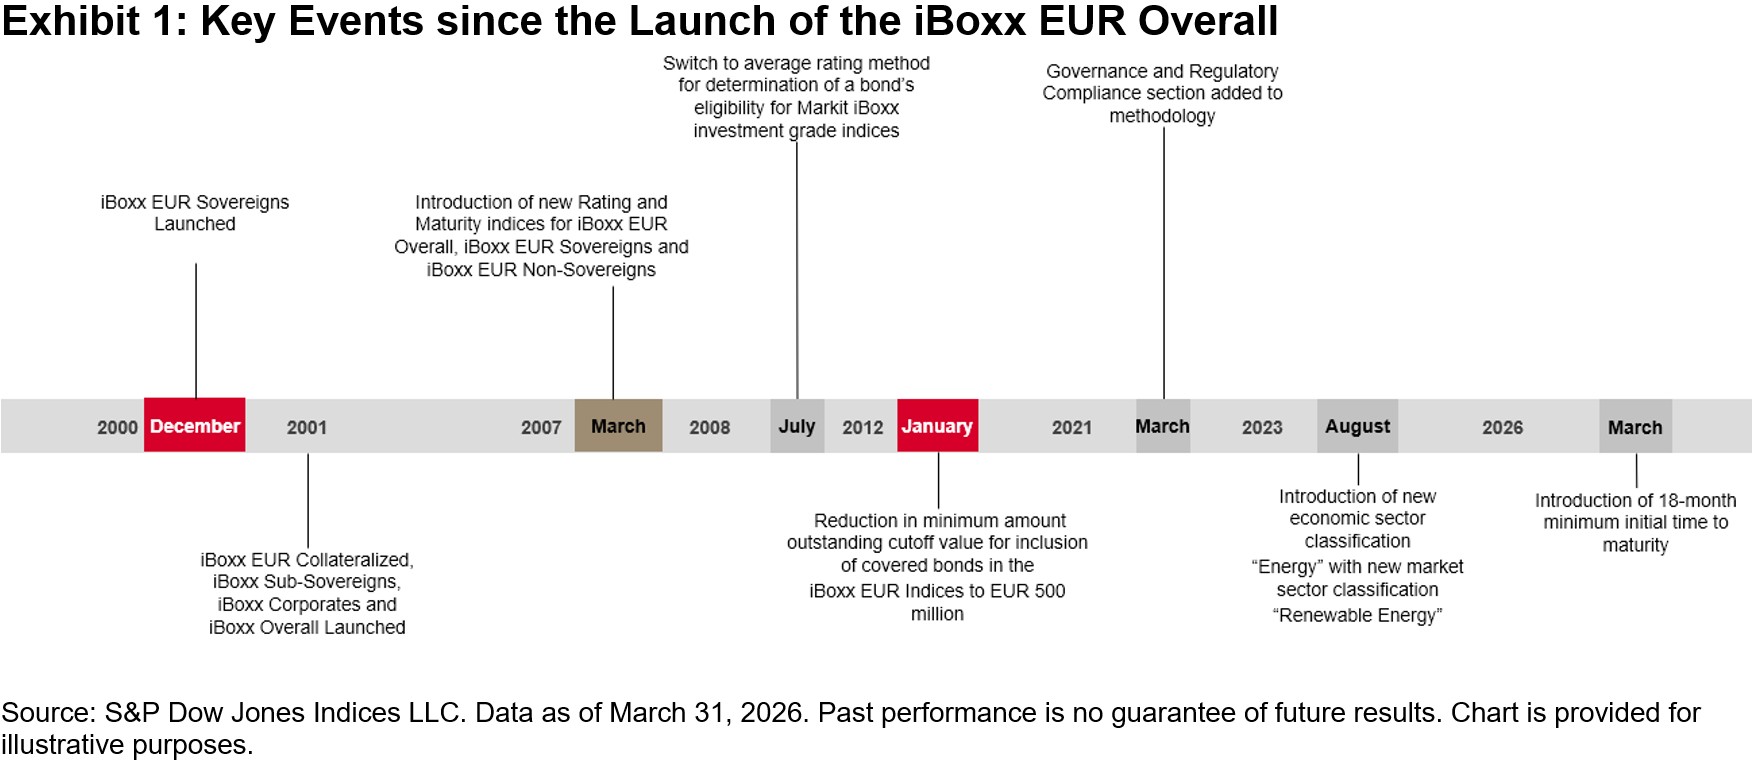
The journey began in 2000 with the launch of the iBoxx EUR Sovereigns, at a time when the eurozone bond market was still taking shape and investors were looking for transparent benchmarks. As the market expanded, new building blocks followed, including the iBoxx EUR Collateralized, iBoxx Sub‑Sovereigns and iBoxx Corporates. These eventually came together under the iBoxx EUR Overall, which was introduced to provide a single view of the EUR‑denominated bond universe.

A turning point came in July 2012, during the eurozone sovereign crisis. Disagreements between rating agencies were creating volatility and liquidity concerns, and the use of the lowest rating in index rules amplified these issues. The switch to an average rating was introduced to address this, offering a more balanced and stable way of assessing credit quality within the indices.

Another step in the evolution arrived in August 2023 with the introduction of a dedicated renewable energy sector classification. This reflected both the rapid growth in issuances linked to renewable energy projects and the shift in investor focus, supported by policy changes such as the EU raising its 2030 renewable energy target from 32% to 45%.1, 2, 3 Recognizing renewable energy as its own sector ensured that the indices reflected a part of the market with distinct characteristics, risk profiles and growing strategic importance.

The most recent development came in March 2026, when an 18‑month minimum initial time to maturity was introduced to align the iBoxx EUR indices with industry practice and remove short‑dated bonds that offered limited contribution to the index profile.

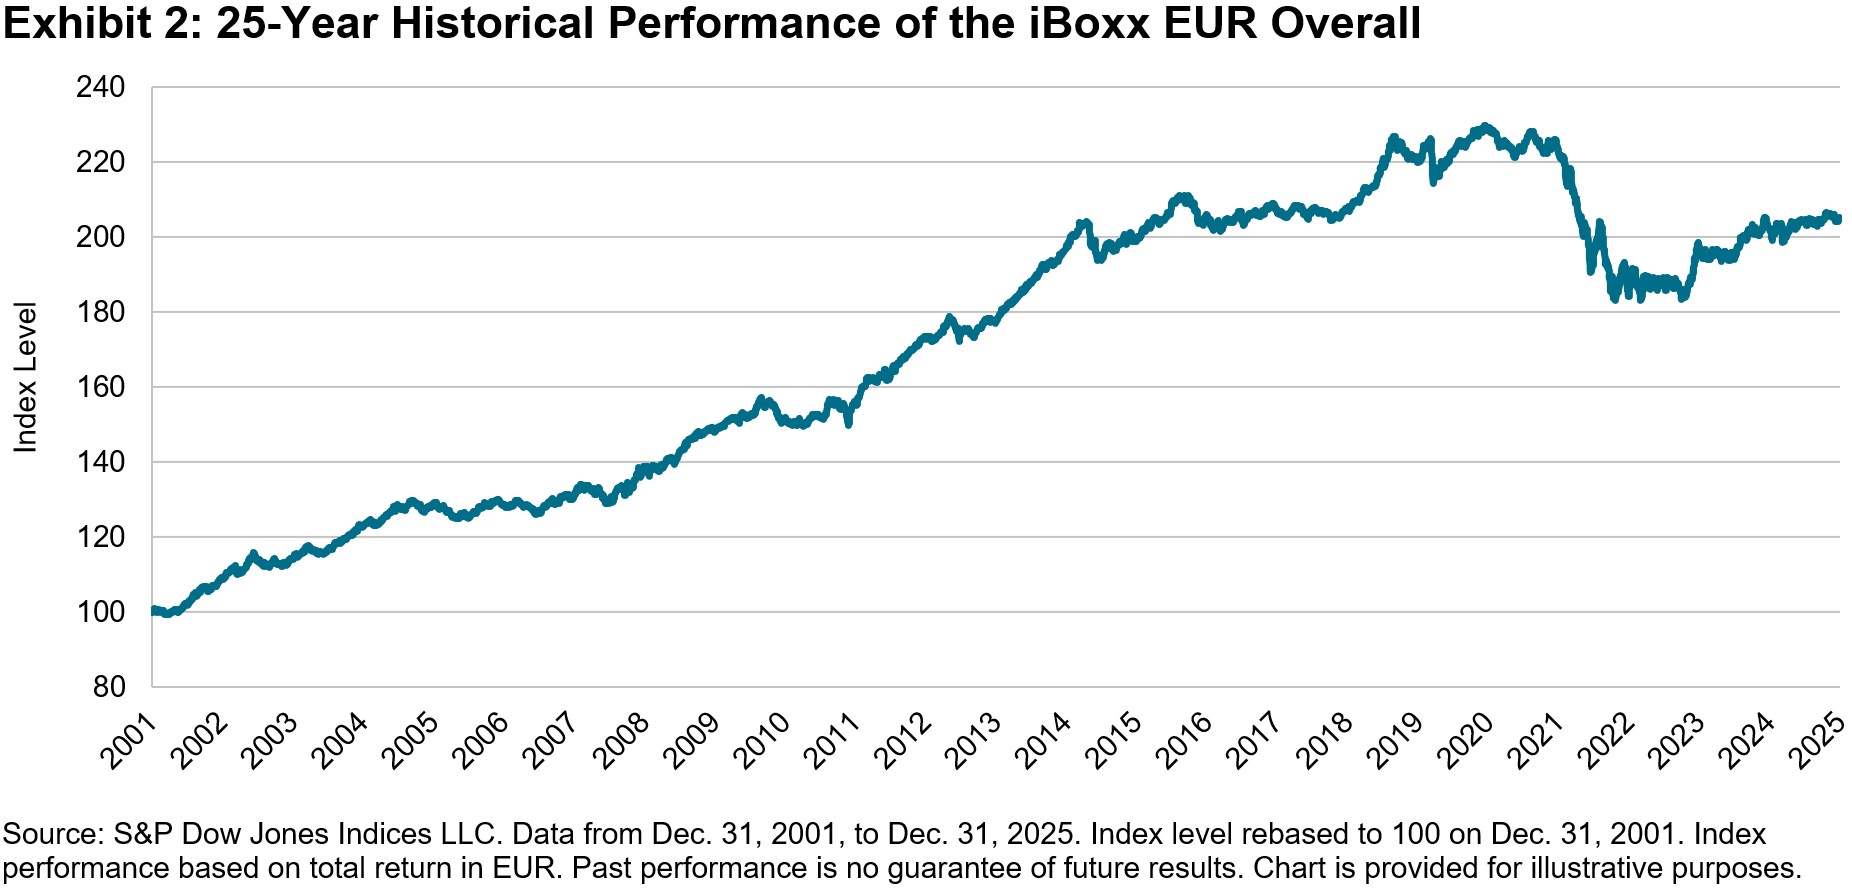
The long-term performance of the iBoxx EUR Overall illustrates how the index has changed over 25 years of shifting market conditions (see Exhibit 2).

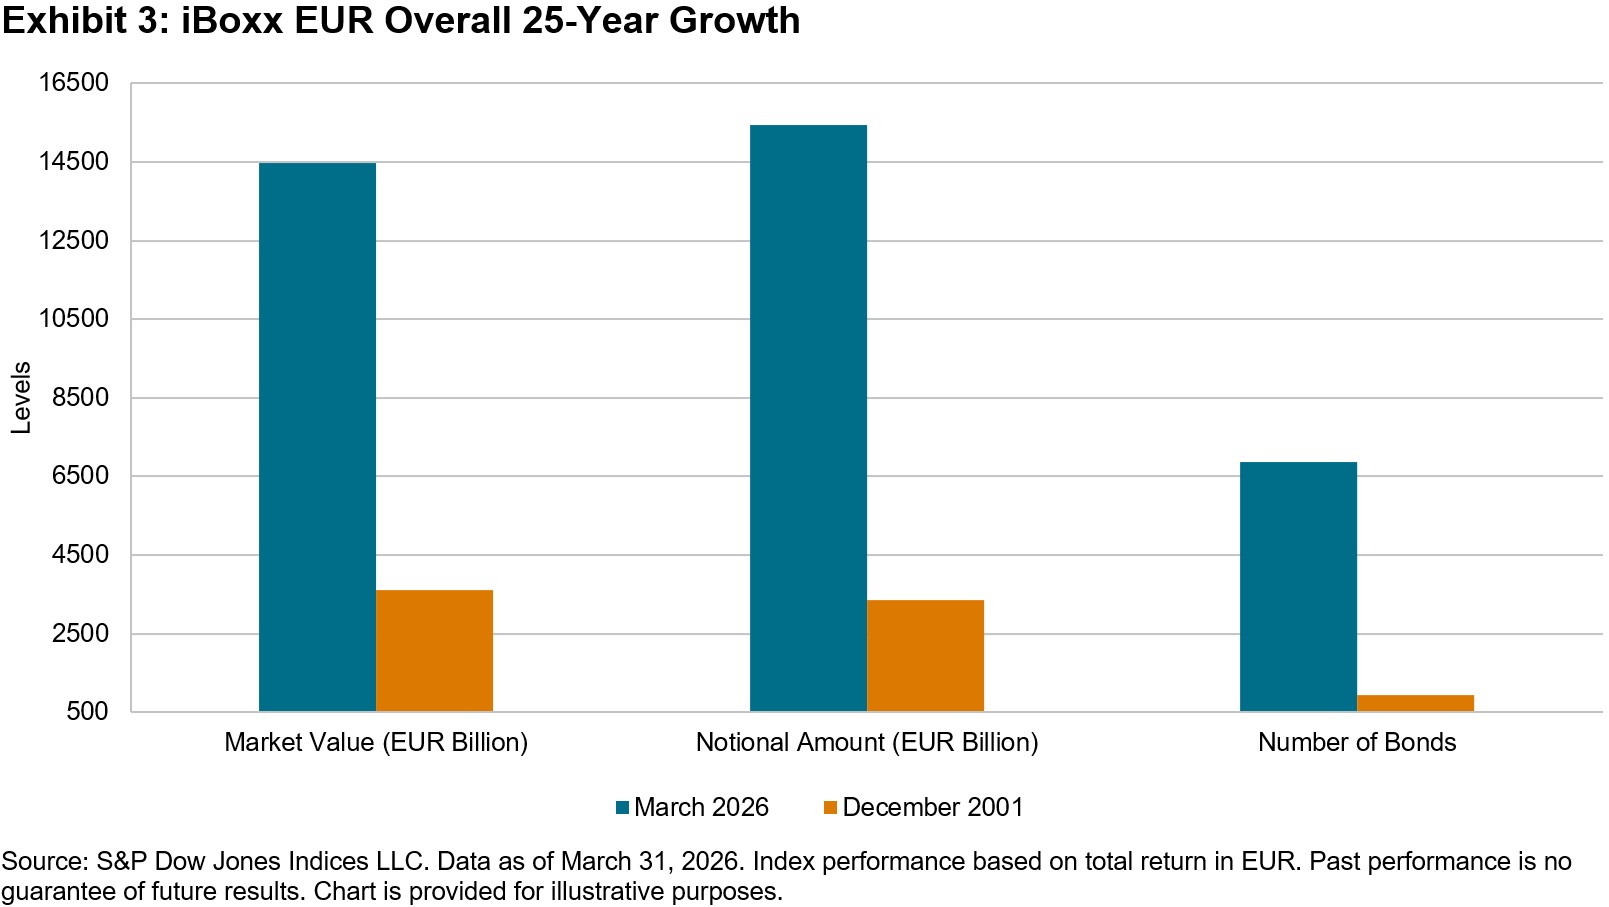
Market size and issuance have grown increasingly over the past 25 years (see Exhibit 3). As the iBoxx EUR indices expanded to reflect larger segments of the investable market, this growth reflected a series of major macro events, including quantitative easing, the sovereign debt crisis and the broader influence of central bank policy. The iBoxx EUR Overall index has grown alongside these developments, both responding to them and being shaped by the shifts in liquidity, yields and issuance patterns that followed.

The rise in notional amounts highlights not only the increase in issuance and market liquidity, but also the expansion of ESG and green bonds, the development of new corporate sub-sectors and the inclusion of a wider range of bond types. As the investable universe broadened and investor demand increased, fixed income indexing evolved to incorporate these instruments, ensuring that the indices reflected a larger and more diverse portion of the market with meaningful growth potential.

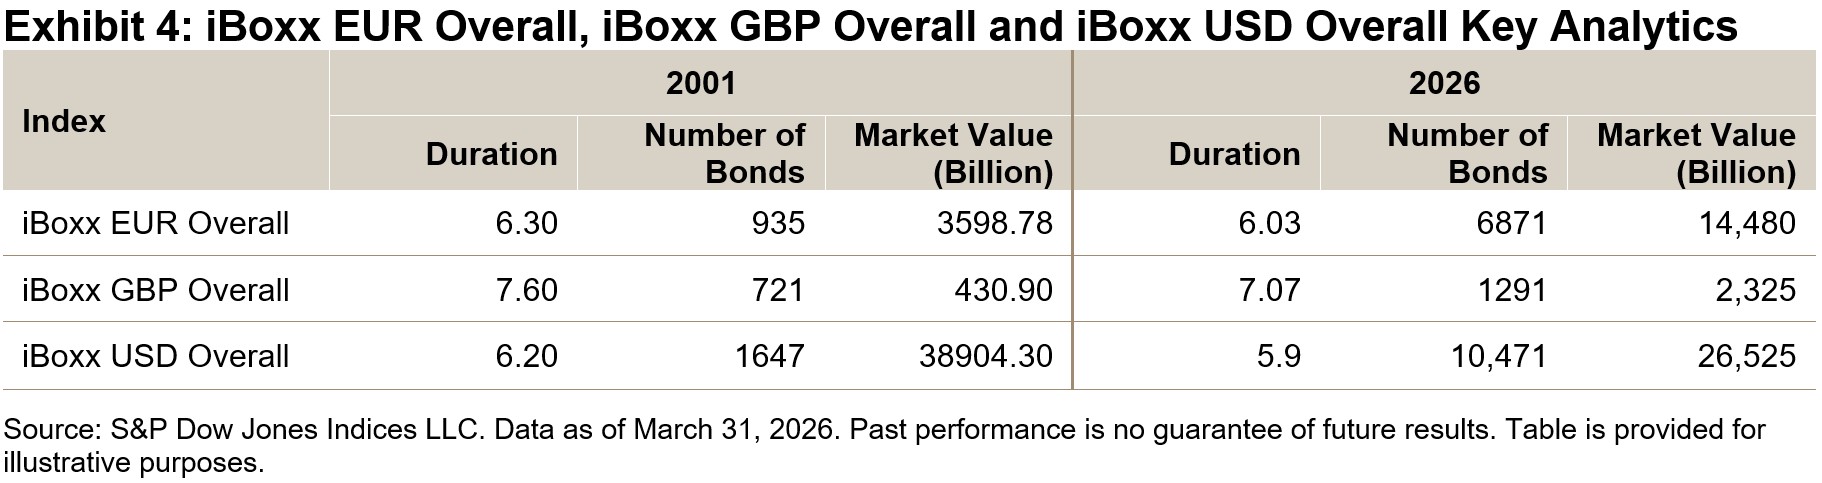
We see duration shorten across other key index series including the iBoxx GBP Overall and iBoxx USD Overall, reflecting a market that has steadily moved toward shorter maturities (see Exhibit 4). Repeated macro shocks, post‑crisis regulation and the shift away from years of unusually low rates pushed issuers to favor shorter, more flexible borrowing, and fixed income indices have naturally followed as the composition of the investable universe has shifted.

The iBoxx EUR series began with a strong focus on sovereigns, and this is reflected in the early composition of the index, where sovereigns accounted for 73% of the universe in 2001. Over time, this dominance eased to 64% in 2026 as new and more specialized corporate subsectors began to emerge. As the market broadened, the index evolved into a more diversified and representative view of the investable EUR bond universe.

We see the appearance and gradual growth of corporate subsectors such as Technology, Energy, Real Estate and Health Care (see Exhibit 5). These developments coincided with several structural shifts in the market: the rise of REITs issuing EUR debt, increased capital‑raising from Technology firms as cyber- and AI‑related investment accelerated, and the expansion of the Energy sector as renewable energy developers issued bonds to finance large‑scale infrastructure projects. Together, these changes reflect how the index adapted to reflect new sources of issuance and the evolving shape of the European economy.

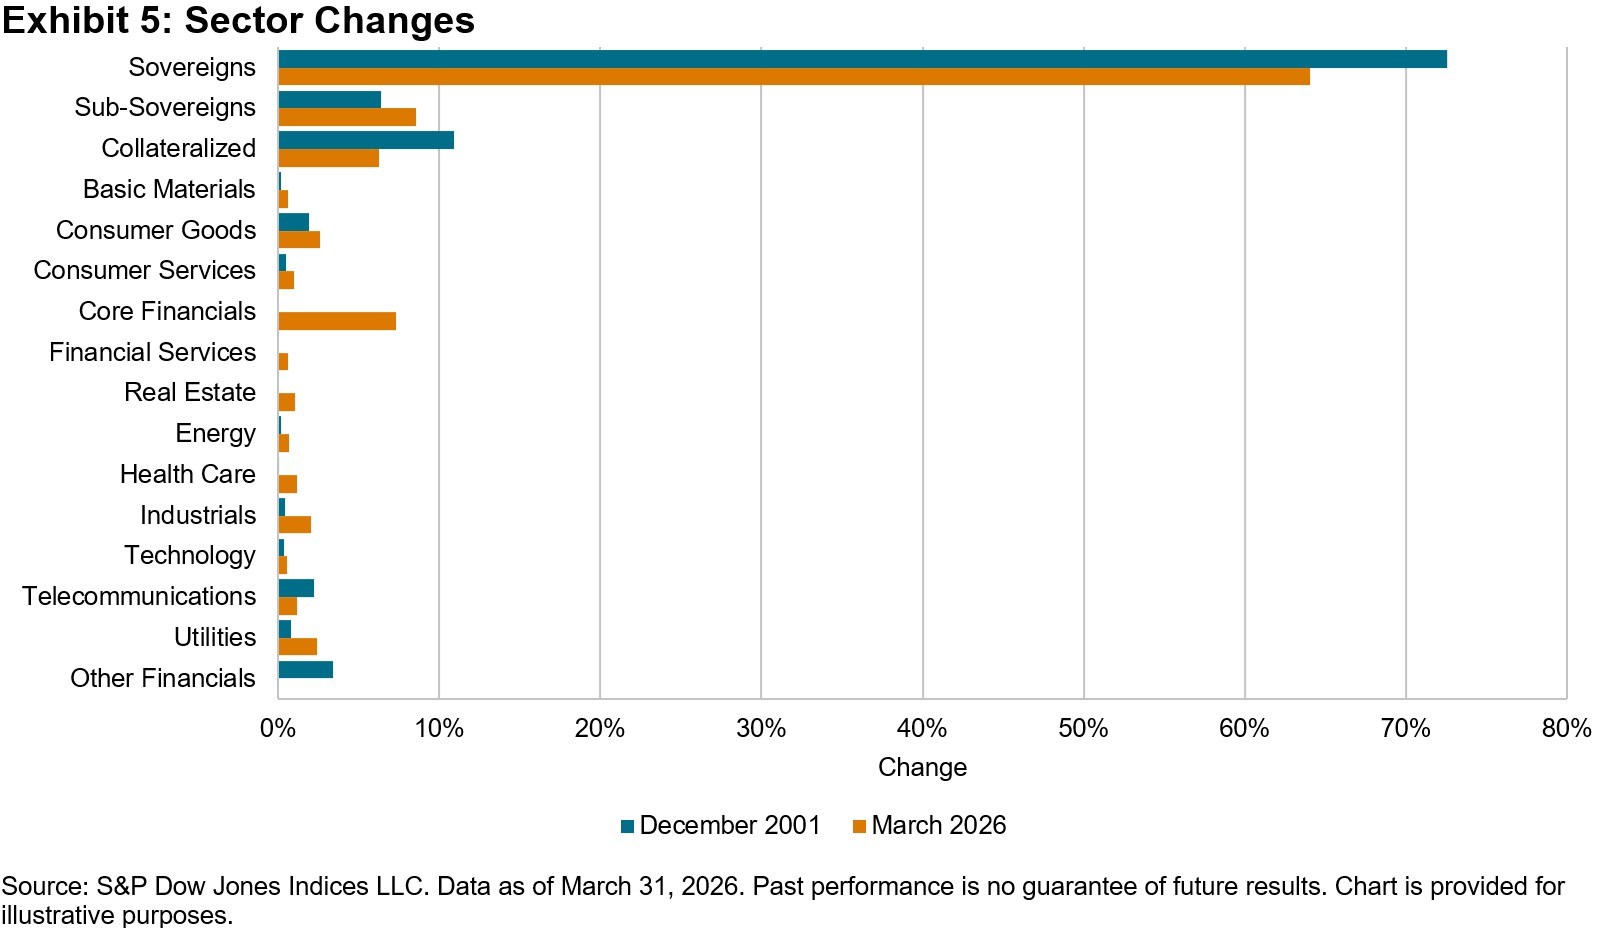
The additional financial classifications are particularly notable. Following the 2008 Global Financial Crisis, regulation reshaped the Financial Services sector and exposed the need for clearer distinctions between different types of issuers. As banks, insurers and other financial institutions issued increasingly varied forms of debt, the index methodology evolved to separate these categories, improving the accuracy and relevance of sector representation.

The past 25 years highlight how fixed income indexing has evolved with changes in market structure. Looking ahead, infrastructure investment, hyperscalers, data‑center expansion, emerging corporate subsectors and the shift of private‑market‑style structures into public markets are all likely to guide how classifications, subsectors and bond‑type coverage develop, and the iBoxx indices will continue to evolve to reflect these themes as they take shape.

1Renewable energy,” Fact Sheets on the European Union. European Parliament.

2EU Market Outlook for Solar Power 2023-2027.” Solar Power Europe, Dec. 12, 2023.

3 For more information, please see the iBoxx EUR Benchmark Index Methodology.

The posts on this blog are opinions, not advice. Please read our Disclaimers.

The Kingdom's Edge: Finding Asymmetry and Growth in Saudi Equities

Contributor Image
Carlos Mendizabal

Senior Analyst, Global and Thematic Equity Indices Product Management

S&P Dow Jones Indices

In early 2026, equity markets were shaken by the outbreak of war in the Middle East, triggering sharp energy price spikes and renewed inflation concerns. This blog explores how despite the challenging backdrop, Saudi Arabian equities have shown notable resilience, demonstrating their diversification characteristics during periods of heightened downside risk in global markets.

Gauging Saudi Arabian Equities with Caps

The S&P Saudi Arabia BMI 5/10/40 Capped Index tracks the performance of the S&P Saudi Arabia BMI while complying with UCITS 5/10/40 diversification requirements. Under this framework, no single constituent may exceed a 10% weight, and constituents with weights above 5% may not collectively exceed 40%.

Constituent eligibility is determined in accordance with the S&P Global BMI methodology and reflects applicable foreign ownership limits. Float adjustment incorporates both theoretical and practical foreign ownership constraints set by the Saudi Capital Market Authority, which permits Qualified Foreign Investors to own up to 49% of a company’s shares.1

The index is float-adjusted-market-capitalization weighted and rebalanced quarterly, with daily monitoring to trigger contingent intra-quarter rebalancing if concentration thresholds are breached.

Measuring Saudi Equities beyond the Barrel

The S&P Saudi Arabia BMI 5/10/40 Capped Index offers a unique sector composition. The index shows that the country’s market is dominated by Financials (35%), reflecting the scale and profitability of domestic banks that benefit from strong balance sheets, rising credit penetration and sustained public- and private-sector investment activity. Materials (19%) and Energy (10%) form the next largest weights, highlighting the importance of petrochemicals and the energy-related value chain.

In contrast to many global and emerging market benchmarks that are heavily skewed toward growth and technology, the S&P Saudi Arabia BMI 5/10/40 Capped Index has minimal weight in Information Technology (2%), as well as comparatively lower weights in Consumer Discretionary, Consumer Staples (4% each) and Industrials (4%). This sector mix has resulted in a market that is less sensitive to global growth cycles, valuations and technology-led sentiment shifts.

Underpinning this equity makeup is the country’s Vision 20302 initiative, which is a highly ambitious strategic framework designed to diversify the economy away from oil. Key objectives include expanding tourism and entertainment, advancing high-tech industries and promoting sustainability through large-scale investments. Together, these initiatives are reshaping economic activity and broadening the sources of long-term growth.

A Shelter in the Time of Storm

As shown in Exhibit 2, the S&P Saudi Arabia BMI 5/10/40 Capped Index has maintained a low correlation to global and regional benchmarks over time, making it a source of diversification.

This diversification is driven by the market’s weight in real assets and domestic demand, which reduces its sensitivity to global economic growth and technology cycles. Importantly, Saudi equities have also demonstrated an asymmetric performance profile. Historically, the index participated in around 56% of global equity upside while limiting downside participation to just 35% versus the S&P Global BMI.

These attributes were evident in recent performance. In the first quarter of 2026, the S&P Saudi Arabia BMI 5/10/40 Capped Index had a 7.1% total return in USD, outperforming most major developed and emerging market benchmarks, which were negative.

The index’s outperformance was supported by rising energy prices, resilient fiscal conditions and limited sensitivity to lagging technology stocks. Similar resilience was observed during periods of global equity stress in 2018 and 2022.

Rounding Up

The S&P Saudi Arabia BMI 5/10/40 Capped Index tracks a market with distinctive attributes. With the backdrop of the ambitious Vision 2030 framework underpinning the long-term market landscape, the index’s unique sector profile provides diversification potential and has historically offered downside mitigation.

1 For a detailed description of the index construction framework, please refer to the S&P Pan Arab Index Methodology. In addition, S&P Dow Jones Indices maintains multiple Saudi Arabia index variants designed to meet the needs of different investor segments, including domestic, Gulf Cooperation Council‑regional and international investors.

2 vision2030.gov.sa

The posts on this blog are opinions, not advice. Please read our Disclaimers.

The S&P 500 Catholic Values Index: 10 Years and Counting - Part 2

Contributor Image
Maria Sanchez

Director, Sustainability Index Product Management, U.S. Equity Indices

S&P Dow Jones Indices

The S&P 500® Catholic Values Index has a decade-long track record that highlights the historical effectiveness of its sector-neutral approach to values-based indexing.

An important feature of the S&P Catholic Values Indices Methodology is its sector weight redistribution approach. Rather than allowing exclusions to create potential sector tilts, the weights of excluded companies are proportionally distributed within their respective GICS® sectors, helping the index maintain its broad market representation. This approach leads to sector neutrality, which is evident in Exhibit 1.

This sector approach has helped the index maintain low tracking error versus the S&P 500 historically, which may be a relevant consideration when evaluating values-based mandates. Over the past decade, the S&P 500 Catholic Values Index has maintained a tracking error within 1.4% of the S&P 500 while excluding an average of 52 companies. During the latest rebalance, effective after the close of March 20, 2026, 55 companies were excluded, representing 12.70% of the S&P 500 as of the reference date. This represents approximately 87% market-cap coverage of the S&P 500.

The S&P 500 Catholic Values Index has demonstrated risk-adjusted performance comparable to that of the S&P 500 since the index was launched, with annualized performance of 0.86% versus 0.82% for the S&P 500. The historical comparison of the index’s characteristics demonstrates its consistency compared with the benchmark.

The S&P 500 Catholic Values Index’s decade of performance history demonstrates that values-based indices may not mean compromised performance relative to the benchmark. As a result, the S&P 500 Catholic Values Index may serve as a relevant benchmark for those seeking to align religious values with passive investing strategies.

The posts on this blog are opinions, not advice. Please read our Disclaimers.

The Significance of Select Sectors to APAC

Contributor Image
Liam Flaherty

Senior Analyst, Index Investment Strategy

S&P Dow Jones Indices

As investors across the globe have wrestled with the impact of AI on the U.S. tech sector, valuation concerns, inflation jitters and more, U.S. markets have underperformed their Pan Asian peers. The S&P 500® has trailed the S&P Pan Asia BMI by 8% YTD,1 however the tide may be turning. Thanks to optimism surrounding easing geopolitical concerns, The 500® notched three consecutive record highs on April 15-17, 2026.

Notwithstanding recent market gyrations, U.S. equities have outperformed their Pan Asian counterparts over the long term,2 with the S&P 500 outperforming the S&P Pan Asia BMI by a cumulative 360% since 2000.

Considering that U.S.-domiciled stocks accounted for a majority of the market cap in 10 of the 11 sectors in the S&P Global BMI as of year-end 2024,3 adopting a sectoral perspective4 can be helpful to understand the sources of U.S. equity outperformance compared with equities in Pan Asia. Exhibit 2 shows that much of this outperformance can be attributed to within-sector stock selection, particularly in the Consumer Discretionary and Communication Services sectors, which house many of the Big Tech names that have dramatically outperformed in recent years.

On a more granular level, Exhibit 3 compares the performance of S&P Pan Asia BMI sectors versus the Select Sector Indices, which track the performance of S&P 500 sectors while capping the weight of individual stocks. The exhibit shows that 9 of the 11 Select Sector Indices outperformed S&P Pan Asia BMI sectors and 8 of the 11 Select Sector Indices outperformed the S&P Pan Asia BMI overall. Outperformance was led by the Communication Services and Consumer Discretionary sectors, consistent with the results observed in Exhibit 2.

In addition to outperformance from stock selection within sectors, the attribution in Exhibit 2 shows that the U.S. also benefited from selection across sectors, particularly in Information Technology, which contributed more than one-fifth of U.S. outperformance relative to Pan Asia. Exhibit 4 compares the sector weights of the S&P 500 and the S&P Pan Asia BMI. The U.S. had a greater weight in the Information Technology sector, while S&P Pan Asia had greater weights in Industrials and Financials.

The Select Sector Indices can provide APAC investors with a framework for analyzing U.S. sector-level performance, and provide insights into sectors that include some of the largest companies in the world.

1 As of April 15, 2026.

2 Pathak, Amit. “Why Does The S&P 500 Matter to APAC?” S&P Dow Jones Indices LLC. April 25, 2025.

3 Weng, Fei. “U.S. Sector Relevance to China.” S&P Dow Jones Indices LLC. March 6, 2024.

4 Flaherty, Liam. “Stocks, Sectors and Success?” S&P Dow Jones Indices LLC. Feb. 3, 2026.


The posts on this blog are opinions, not advice. Please read our Disclaimers.

Using Select Sectors to Evaluate Opportunities and Risks

What’s the relevance of U.S. sectors globally in the current landscape? Join S&P DJI’s Hamish Preston and State Street Investment Management’s Matt Bartolini as they explore the Select Sector Indices and how they are helping market participants evaluate and express sector views across evolving market conditions. 

The posts on this blog are opinions, not advice. Please read our Disclaimers.