Get Indexology® Blog updates via email.

In This List

Firewall as the Frontline

Beyond Borders: The Significance of the S&P 500 in Options-Based Strategies

The Evolution of Fixed Income Indexing: A Look over 25 Years

The Kingdom's Edge: Finding Asymmetry and Growth in Saudi Equities

The S&P 500 Catholic Values Index: 10 Years and Counting - Part 2

Firewall as the Frontline

Contributor Image
Srineel Jalagani

Senior Director, Thematic Indices

S&P Dow Jones Indices

Cybercrime’s AI Moment

Cybersecurity has recently entered the crosshairs amid advances in AI. The preview of Claude Mythos has raised concerns among government and industry officials about its broader implications for an increasingly digital economy. That growth in digital commerce has brought cybercrime with it, exploiting the anonymity and borderless nature of the web to grow in both scale and sophistication. Estimated at USD 220 billion globally, cybersecurity spending is forecast to grow 13% annually, underscoring the sector’s rising importance as AI reshapes the threat landscape.

Tracking Cybersecurity: Construction and Performance

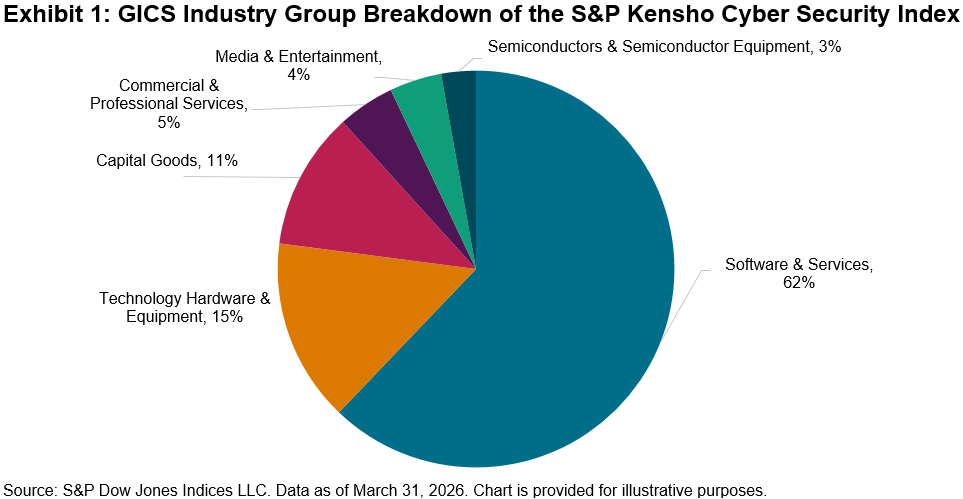
Given its significance to both today’s and tomorrow’s economy, Cyber Security is one of 25 themes within the S&P Kensho New Economies framework driving the Fourth Industrial Revolution. The S&P Kensho Cyber Security Index includes only companies whose primary business is cybersecurity, reflecting the sector’s depth and maturity.1

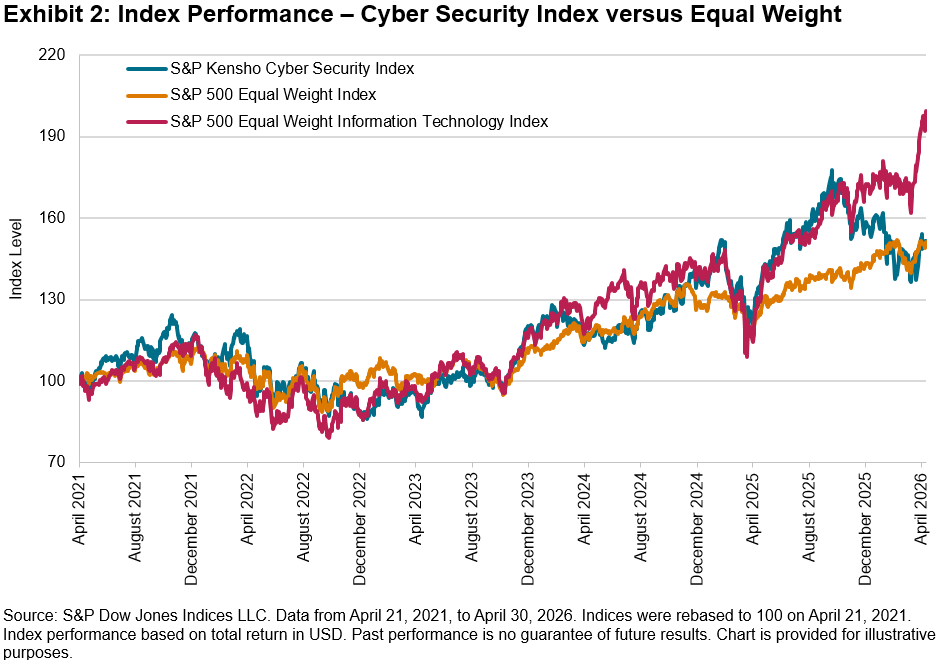
The S&P Kensho Cyber Security Index delivered a five-year annualized total return of 9%, in line with the S&P 500 Equal Weight Index, and outperformed it over the three-year period. A modified equal weighting methodology was chosen for the S&P Kensho Cyber Security Index to avoid the concentration risk that characterizes many technology-linked indices, and performance is therefore compared against equal-weighted benchmarks. Since peaking in October 2025 alongside the broader market, the index has churned to a flat YTD return and sits 13% below its historic high, as markets continue to weigh AI’s ultimate impact on the sector.

Dressed as Software, Built Like Defense

While cybersecurity is software by definition and closely correlated with Software & Services industry group, the segment makes a compelling case for greater resilience to AI disruption. Unlike much of the software world, cybersecurity spending is largely non-discretionary, underpinned by regulatory mandates that persist regardless of the economic cycle or technological change. Rather than a threat, AI may prove to be a catalyst. Expanding digital touchpoints widens the scope for malware attacks, driving demand for greater governance, compliance and protection. The net effect points to an expanding total addressable market for cybersecurity, with AI creating demand faster than it automates existing functions.

Cybersecurity and broader software indices have faced headwinds in recent months, while defense stocks have moved in the opposite direction, buoyed by rising geopolitical tensions. This divergence, however, may obscure a deeper connection, as governments across major economies now explicitly identify cybersecurity as a national security priority, blurring the line between digital and physical defense.2, 3, 4

Defense without Borders

Treating cybersecurity as an integral part of the broader security landscape, we track this theme through two complementary indices:

  • The S&P Kensho Future Security Index5 takes a forward-looking view, positioning Cyber Security alongside Space, Robotics, Drones and Wearables as the technologies defining the future of the security landscape.
  • The S&P Atlas Security, Defense, and Operational Support Index offers a ready-made group of constituents spanning the full security landscape across eight clusters, including Digital Security, Aerospace, Weaponry and Robotics, covering both established and emerging defense technologies. Constituents are selected globally using an AI/NLP framework developed by Theia Insights. The index forms part of the broader S&P Atlas Thematic Indices suite, designed to reflect both current and future drivers of a theme within a single diversified framework.

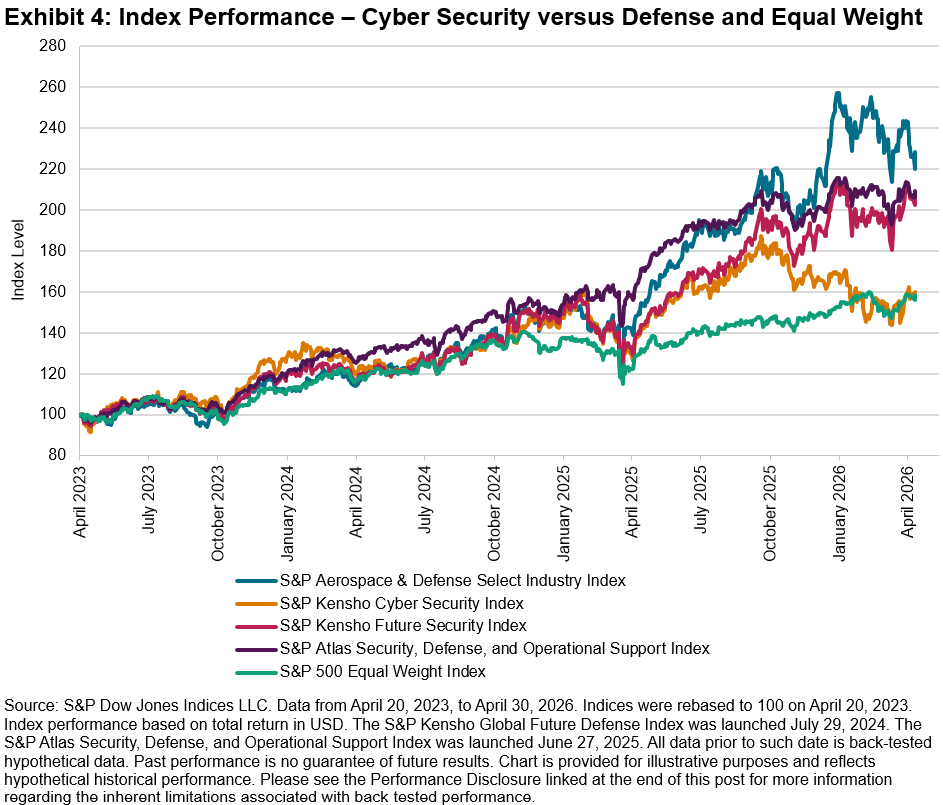
The S&P Kensho Future Security Index has delivered strong performance, posting a three-year annualized gain of 29%, slightly behind the S&P Aerospace & Defense Select Industry Index. The performance differential is partially attributed to the modified equal weight approach of the Kensho index relative to the float market cap weighting of the S&P Aerospace & Defense Select Industry Index.

The S&P Atlas Security, Defense, and Operational Support Index has taken a more balanced path over the same period, broadly tracking the defense theme while retaining cybersecurity as a core cluster. This reflects the blend of established defense and emerging security technologies that are included in the index.

Conclusion

Cybersecurity sits at a crossroads. AI has placed it under scrutiny as a software sector, yet simultaneously strengthened its case as a defense priority. As that tension plays out, the S&P Kensho Cyber Security Index, S&P Kensho Future Security Index and S&P Atlas Security, Defense, and Operational Support Index provide three ways to track this evolving theme, from pure-play cybersecurity to the full breadth of the modern security landscape.

1 The S&P Kensho Global Cyber Security Screened Index extends this benchmark to a global universe of companies, with an additional layer of sustainability-based eligibility criteria required for inclusion.

2 Shift in U.S. Cyber Strategy: What the White House’s New Offensive Cyber Posture Signals for Businesses. Baker Donelson. March 10, 2026.

3 NIS2 Directive: securing network and information systems, European Comission.

4 Outline of the Cybersecurity Strategy. National Cybersecurity Office, Japan. Dec. 23, 2025.

5 The S&P Kensho Global Future Defense Index extends this benchmark to a global universe of companies.

The posts on this blog are opinions, not advice. Please read our Disclaimers.

Beyond Borders: The Significance of the S&P 500 in Options-Based Strategies

Contributor Image
Sue Lee

APAC Head of Index Investment Strategy

S&P Dow Jones Indices

In the U.S. market, options-based ETFs have experienced exponential growth in recent years, with total assets reaching USD 245 billion as of December 2025. These strategies have been increasingly adopted as mainstream tools in portfolio construction, offering more predictable outcomes and income diversification.

Other regions are catching up with this trend at varying rates, with some accelerating rapidly while others are adapting regulations to allow this segment to grow in their local markets. Canada is by far the largest market outside of the U.S., with options-based ETF assets totaling USD 30 billion as of March 2026, followed by South Korea (USD 9 billion) and Europe (USD 8 billion). Hong Kong has also seen rapid expansion, accumulating over USD 4 billion in assets since the debut of its first covered call ETF in early 2024.

While covered call strategies remain dominant in international markets, accounting for 92% of the total assets compared to 62% in the U.S., each market has developed distinct approaches to product design and management. In markets such as Hong Kong, Australia and Canada, options-based ETFs are largely managed actively, mirroring the U.S. where 91% of assets are actively managed.1 Conversely, in markets such as South Korea and Japan, most assets track options-based indices to provide targeted outcomes (see Exhibit 2).

The underlying assets for options being used in ETFs also vary. U.S. benchmarks such as the S&P 500® and Nasdaq 100 are the most popular choices in Europe and Japan, while local indices dominate in Hong Kong. Single-stock options are prevalently used in Canada, while South Korea exhibits a relatively balanced distribution across U.S. indices, local indices, stocks and other asset classes (see Exhibit 3).

Notably, the S&P 500 remains a premier choice in many markets outside of the U.S., thanks to its unparalleled around-the-clock liquidity. These products often tap into the S&P 500 option liquidity2 outside standard U.S. trading hours.  The non-U.S. trading hour3 liquidity has improved significantly, with average daily traded notional4 reaching USD 132 billion in 2025 (see Exhibit 4). This deep, continuous liquidity pool facilitates the effective implementation of various strategies based on S&P 500 options globally, catering to diverse investment objectives and preferences.

For a deeper dive into the index framework of options-based strategies, see “Defining Paths with Options-Based Index Strategies.”

1 Note that some ETFs are run in a manner that is notably different to traditional active management. For example, a fund described as active may exclusively use S&P 500-linked derivatives and exhibit performance very similar to an index representing the overall strategy.

2 See Edwards, Tim et al. “The Liquidity Landscape: Trading Linked to S&P DJI Indices,” S&P Dow Jones Indices.

3 Non-U.S. trading hour refers to 5:00 pm to 8:00 am Central Time for E-mini S&P 500 options and Micro E-mini S&P 500 options traded on CME and 7:15 pm to 8:25 am Central Time for S&P 500 Index options (SPX) and Mini-SPX Index options (XSP) traded on Cboe.

4 Dailly traded notional is calculated as index price x contract size x number of contracts traded for the day, with no delta adjustments.

The posts on this blog are opinions, not advice. Please read our Disclaimers.

The Evolution of Fixed Income Indexing: A Look over 25 Years

Contributor Image
Hannah Abrams

Analyst, Fixed Income Product Management

S&P Dow Jones Indices

Over the past 25 years, the iBoxx EUR indices have evolved alongside the market they were built to measure (see Exhibit 1).

The journey began in 2000 with the launch of the iBoxx EUR Sovereigns, at a time when the eurozone bond market was still taking shape and investors were looking for transparent benchmarks. As the market expanded, new building blocks followed, including the iBoxx EUR Collateralized, iBoxx Sub‑Sovereigns and iBoxx Corporates. These eventually came together under the iBoxx EUR Overall, which was introduced to provide a single view of the EUR‑denominated bond universe.

A turning point came in July 2012, during the eurozone sovereign crisis. Disagreements between rating agencies were creating volatility and liquidity concerns, and the use of the lowest rating in index rules amplified these issues. The switch to an average rating was introduced to address this, offering a more balanced and stable way of assessing credit quality within the indices.

Another step in the evolution arrived in August 2023 with the introduction of a dedicated renewable energy sector classification. This reflected both the rapid growth in issuances linked to renewable energy projects and the shift in investor focus, supported by policy changes such as the EU raising its 2030 renewable energy target from 32% to 45%.1, 2, 3 Recognizing renewable energy as its own sector ensured that the indices reflected a part of the market with distinct characteristics, risk profiles and growing strategic importance.

The most recent development came in March 2026, when an 18‑month minimum initial time to maturity was introduced to align the iBoxx EUR indices with industry practice and remove short‑dated bonds that offered limited contribution to the index profile.

The long-term performance of the iBoxx EUR Overall illustrates how the index has changed over 25 years of shifting market conditions (see Exhibit 2).

Market size and issuance have grown increasingly over the past 25 years (see Exhibit 3). As the iBoxx EUR indices expanded to reflect larger segments of the investable market, this growth reflected a series of major macro events, including quantitative easing, the sovereign debt crisis and the broader influence of central bank policy. The iBoxx EUR Overall index has grown alongside these developments, both responding to them and being shaped by the shifts in liquidity, yields and issuance patterns that followed.

The rise in notional amounts highlights not only the increase in issuance and market liquidity, but also the expansion of ESG and green bonds, the development of new corporate sub-sectors and the inclusion of a wider range of bond types. As the investable universe broadened and investor demand increased, fixed income indexing evolved to incorporate these instruments, ensuring that the indices reflected a larger and more diverse portion of the market with meaningful growth potential.

We see duration shorten across other key index series including the iBoxx GBP Overall and iBoxx USD Overall, reflecting a market that has steadily moved toward shorter maturities (see Exhibit 4). Repeated macro shocks, post‑crisis regulation and the shift away from years of unusually low rates pushed issuers to favor shorter, more flexible borrowing, and fixed income indices have naturally followed as the composition of the investable universe has shifted.

The iBoxx EUR series began with a strong focus on sovereigns, and this is reflected in the early composition of the index, where sovereigns accounted for 73% of the universe in 2001. Over time, this dominance eased to 64% in 2026 as new and more specialized corporate subsectors began to emerge. As the market broadened, the index evolved into a more diversified and representative view of the investable EUR bond universe.

We see the appearance and gradual growth of corporate subsectors such as Technology, Energy, Real Estate and Health Care (see Exhibit 5). These developments coincided with several structural shifts in the market: the rise of REITs issuing EUR debt, increased capital‑raising from Technology firms as cyber- and AI‑related investment accelerated, and the expansion of the Energy sector as renewable energy developers issued bonds to finance large‑scale infrastructure projects. Together, these changes reflect how the index adapted to reflect new sources of issuance and the evolving shape of the European economy.

The additional financial classifications are particularly notable. Following the 2008 Global Financial Crisis, regulation reshaped the Financial Services sector and exposed the need for clearer distinctions between different types of issuers. As banks, insurers and other financial institutions issued increasingly varied forms of debt, the index methodology evolved to separate these categories, improving the accuracy and relevance of sector representation.

The past 25 years highlight how fixed income indexing has evolved with changes in market structure. Looking ahead, infrastructure investment, hyperscalers, data‑center expansion, emerging corporate subsectors and the shift of private‑market‑style structures into public markets are all likely to guide how classifications, subsectors and bond‑type coverage develop, and the iBoxx indices will continue to evolve to reflect these themes as they take shape.

1Renewable energy,” Fact Sheets on the European Union. European Parliament.

2EU Market Outlook for Solar Power 2023-2027.” Solar Power Europe, Dec. 12, 2023.

3 For more information, please see the iBoxx EUR Benchmark Index Methodology.

The posts on this blog are opinions, not advice. Please read our Disclaimers.

The Kingdom's Edge: Finding Asymmetry and Growth in Saudi Equities

Contributor Image
Carlos Mendizabal

Senior Analyst, Global and Thematic Equity Indices Product Management

S&P Dow Jones Indices

In early 2026, equity markets were shaken by the outbreak of war in the Middle East, triggering sharp energy price spikes and renewed inflation concerns. This blog explores how despite the challenging backdrop, Saudi Arabian equities have shown notable resilience, demonstrating their diversification characteristics during periods of heightened downside risk in global markets.

Gauging Saudi Arabian Equities with Caps

The S&P Saudi Arabia BMI 5/10/40 Capped Index tracks the performance of the S&P Saudi Arabia BMI while complying with UCITS 5/10/40 diversification requirements. Under this framework, no single constituent may exceed a 10% weight, and constituents with weights above 5% may not collectively exceed 40%.

Constituent eligibility is determined in accordance with the S&P Global BMI methodology and reflects applicable foreign ownership limits. Float adjustment incorporates both theoretical and practical foreign ownership constraints set by the Saudi Capital Market Authority, which permits Qualified Foreign Investors to own up to 49% of a company’s shares.1

The index is float-adjusted-market-capitalization weighted and rebalanced quarterly, with daily monitoring to trigger contingent intra-quarter rebalancing if concentration thresholds are breached.

Measuring Saudi Equities beyond the Barrel

The S&P Saudi Arabia BMI 5/10/40 Capped Index offers a unique sector composition. The index shows that the country’s market is dominated by Financials (35%), reflecting the scale and profitability of domestic banks that benefit from strong balance sheets, rising credit penetration and sustained public- and private-sector investment activity. Materials (19%) and Energy (10%) form the next largest weights, highlighting the importance of petrochemicals and the energy-related value chain.

In contrast to many global and emerging market benchmarks that are heavily skewed toward growth and technology, the S&P Saudi Arabia BMI 5/10/40 Capped Index has minimal weight in Information Technology (2%), as well as comparatively lower weights in Consumer Discretionary, Consumer Staples (4% each) and Industrials (4%). This sector mix has resulted in a market that is less sensitive to global growth cycles, valuations and technology-led sentiment shifts.

Underpinning this equity makeup is the country’s Vision 20302 initiative, which is a highly ambitious strategic framework designed to diversify the economy away from oil. Key objectives include expanding tourism and entertainment, advancing high-tech industries and promoting sustainability through large-scale investments. Together, these initiatives are reshaping economic activity and broadening the sources of long-term growth.

A Shelter in the Time of Storm

As shown in Exhibit 2, the S&P Saudi Arabia BMI 5/10/40 Capped Index has maintained a low correlation to global and regional benchmarks over time, making it a source of diversification.

This diversification is driven by the market’s weight in real assets and domestic demand, which reduces its sensitivity to global economic growth and technology cycles. Importantly, Saudi equities have also demonstrated an asymmetric performance profile. Historically, the index participated in around 56% of global equity upside while limiting downside participation to just 35% versus the S&P Global BMI.

These attributes were evident in recent performance. In the first quarter of 2026, the S&P Saudi Arabia BMI 5/10/40 Capped Index had a 7.1% total return in USD, outperforming most major developed and emerging market benchmarks, which were negative.

The index’s outperformance was supported by rising energy prices, resilient fiscal conditions and limited sensitivity to lagging technology stocks. Similar resilience was observed during periods of global equity stress in 2018 and 2022.

Rounding Up

The S&P Saudi Arabia BMI 5/10/40 Capped Index tracks a market with distinctive attributes. With the backdrop of the ambitious Vision 2030 framework underpinning the long-term market landscape, the index’s unique sector profile provides diversification potential and has historically offered downside mitigation.

1 For a detailed description of the index construction framework, please refer to the S&P Pan Arab Index Methodology. In addition, S&P Dow Jones Indices maintains multiple Saudi Arabia index variants designed to meet the needs of different investor segments, including domestic, Gulf Cooperation Council‑regional and international investors.

2 vision2030.gov.sa

The posts on this blog are opinions, not advice. Please read our Disclaimers.

The S&P 500 Catholic Values Index: 10 Years and Counting - Part 2

Contributor Image
Maria Sanchez

Director, Sustainability Index Product Management, U.S. Equity Indices

S&P Dow Jones Indices

The S&P 500® Catholic Values Index has a decade-long track record that highlights the historical effectiveness of its sector-neutral approach to values-based indexing.

An important feature of the S&P Catholic Values Indices Methodology is its sector weight redistribution approach. Rather than allowing exclusions to create potential sector tilts, the weights of excluded companies are proportionally distributed within their respective GICS® sectors, helping the index maintain its broad market representation. This approach leads to sector neutrality, which is evident in Exhibit 1.

This sector approach has helped the index maintain low tracking error versus the S&P 500 historically, which may be a relevant consideration when evaluating values-based mandates. Over the past decade, the S&P 500 Catholic Values Index has maintained a tracking error within 1.4% of the S&P 500 while excluding an average of 52 companies. During the latest rebalance, effective after the close of March 20, 2026, 55 companies were excluded, representing 12.70% of the S&P 500 as of the reference date. This represents approximately 87% market-cap coverage of the S&P 500.

The S&P 500 Catholic Values Index has demonstrated risk-adjusted performance comparable to that of the S&P 500 since the index was launched, with annualized performance of 0.86% versus 0.82% for the S&P 500. The historical comparison of the index’s characteristics demonstrates its consistency compared with the benchmark.

The S&P 500 Catholic Values Index’s decade of performance history demonstrates that values-based indices may not mean compromised performance relative to the benchmark. As a result, the S&P 500 Catholic Values Index may serve as a relevant benchmark for those seeking to align religious values with passive investing strategies.

The posts on this blog are opinions, not advice. Please read our Disclaimers.