Get Indexology® Blog updates via email.

In This List

Qubits and beyond: Tracking Quantum Computing’s Momentum

The Search for Elusive Outperforming Active Funds in Japan

New Tools for Tracking Sector Liquidity

Harnessing the Power of Multiple Factors: Inside the S&P 500 Quality, Value & Momentum Multi-Factor Index

S&P Global Dividend Aristocrats in Focus: S&P World Ex-Australia High Yield Dividend Aristocrats Select Index

Qubits and beyond: Tracking Quantum Computing’s Momentum

Contributor Image
Luca Ramotti

Associate Director, Thematic Indices

S&P Dow Jones Indices

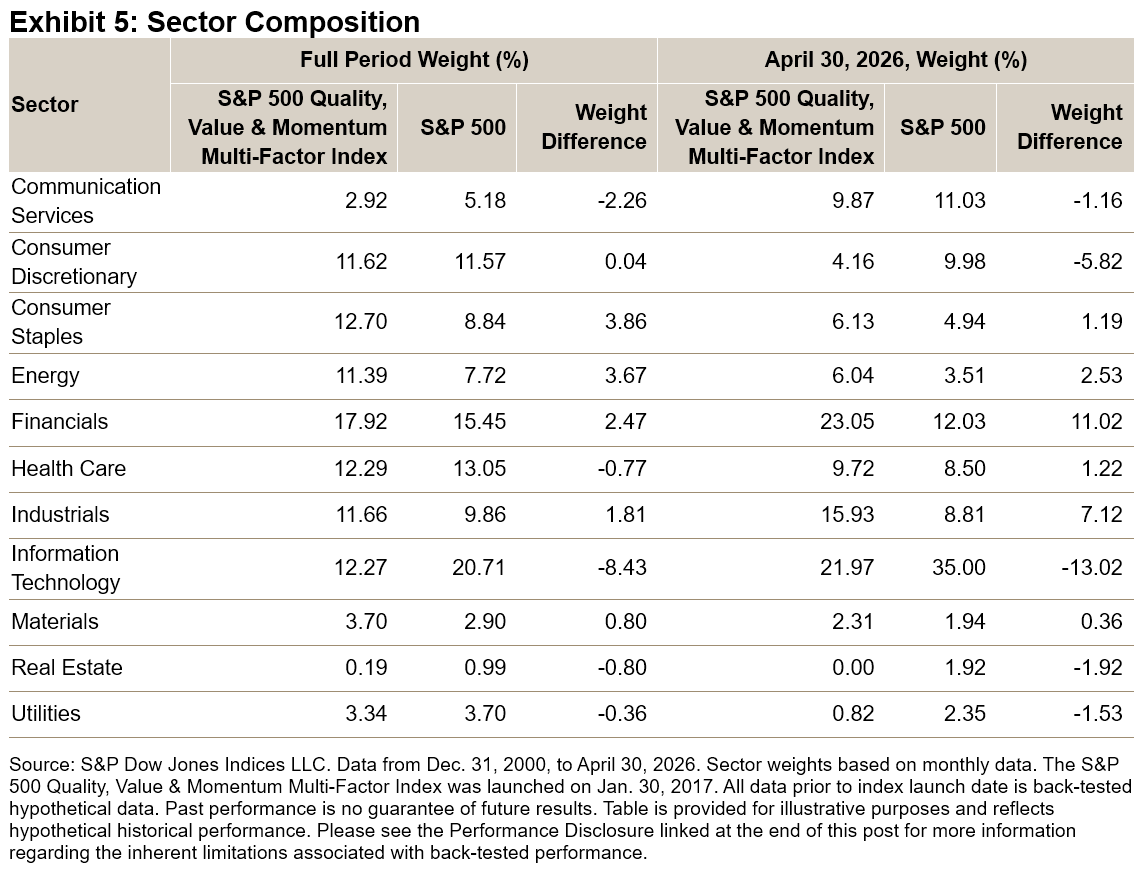
The U.S. government recently committed over USD 2 billion to nine quantum companies under the CHIPS Act,1 taking equity stakes in each. It is a signal that quantum computing has become a matter of national interest. Markets seem to have already been taking note, with the S&P Kensho Global Quantum Computing Technologies Index up 120% since the start of 2025 and 57% quarter-to-date as of May 22, 2026 (see Exhibit 1).

At its core, quantum computing uses qubits. Unlike classical bits that are fixed as either 0 or 1, qubits can exist in a superposition of both states simultaneously until measured. This property makes quantum computers particularly powerful for certain complex problems that are effectively unsolvable by classical computers. The theoretical foundations stretch back decades, but the technology has long been constrained by the difficulty of building stable, error-corrected qubits. In this way, it shares something with AI, where the core ideas preceded the technology needed to make them useful by a generation.

An Index in Motion

Tracking this fast-evolving space requires a different approach than traditional index construction. As described in a previous blog post, the S&P Kensho Global Quantum Computing Technologies Index uses natural language processing (NLP) to identify relevant companies, rather than relying on standard industry or revenue-based classifications. This matters because most pure-play quantum companies do not yet have tangible recurring revenues, making financial screening alone insufficient. The index has doubled from 13 to 26 constituents between 2022 and 2026, with U.S. companies accounting for 69% of the index’s weight, a concentration that mirrors the dominance of U.S. venture capital in funding quantum research.2

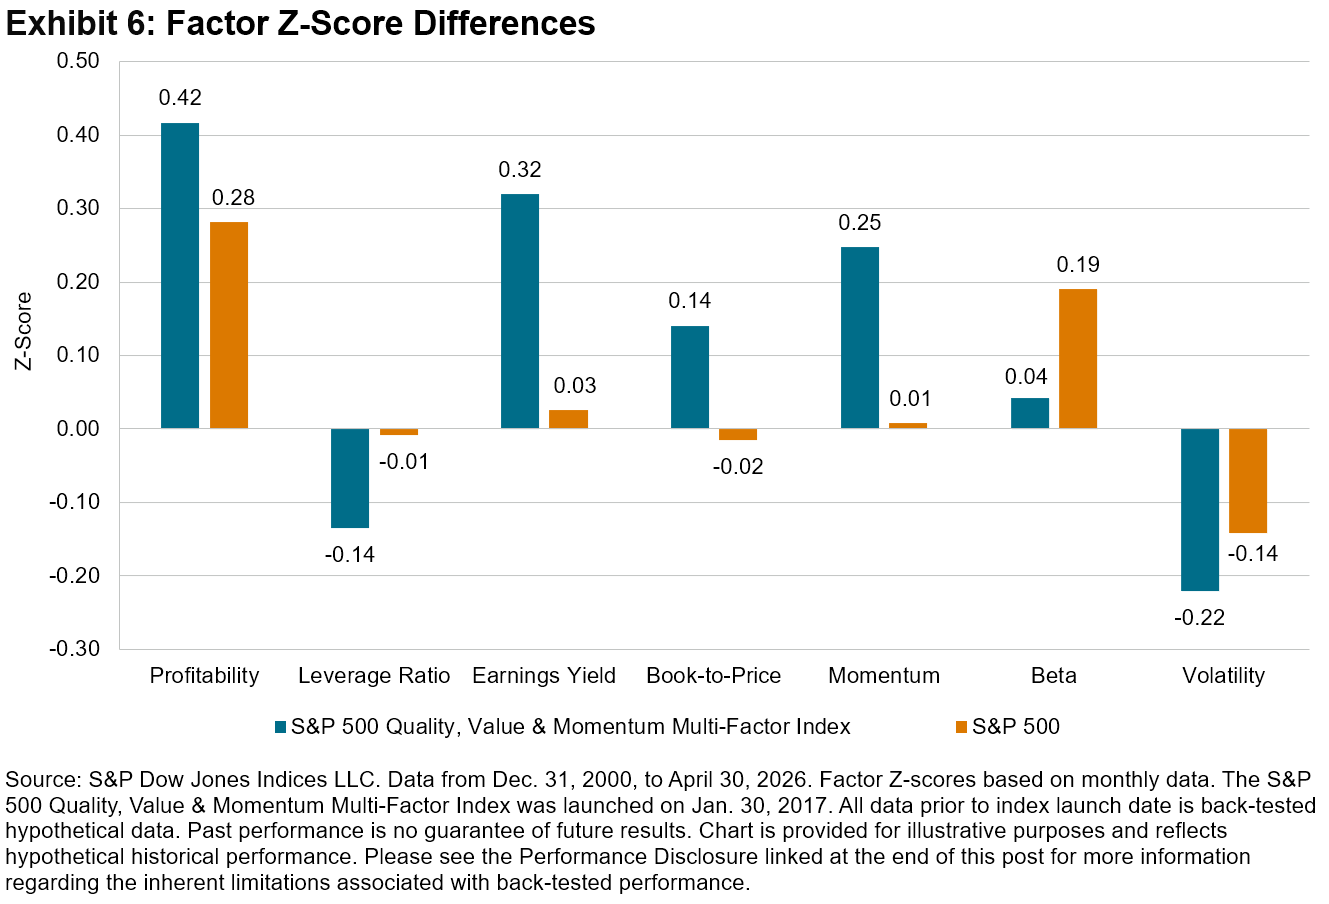
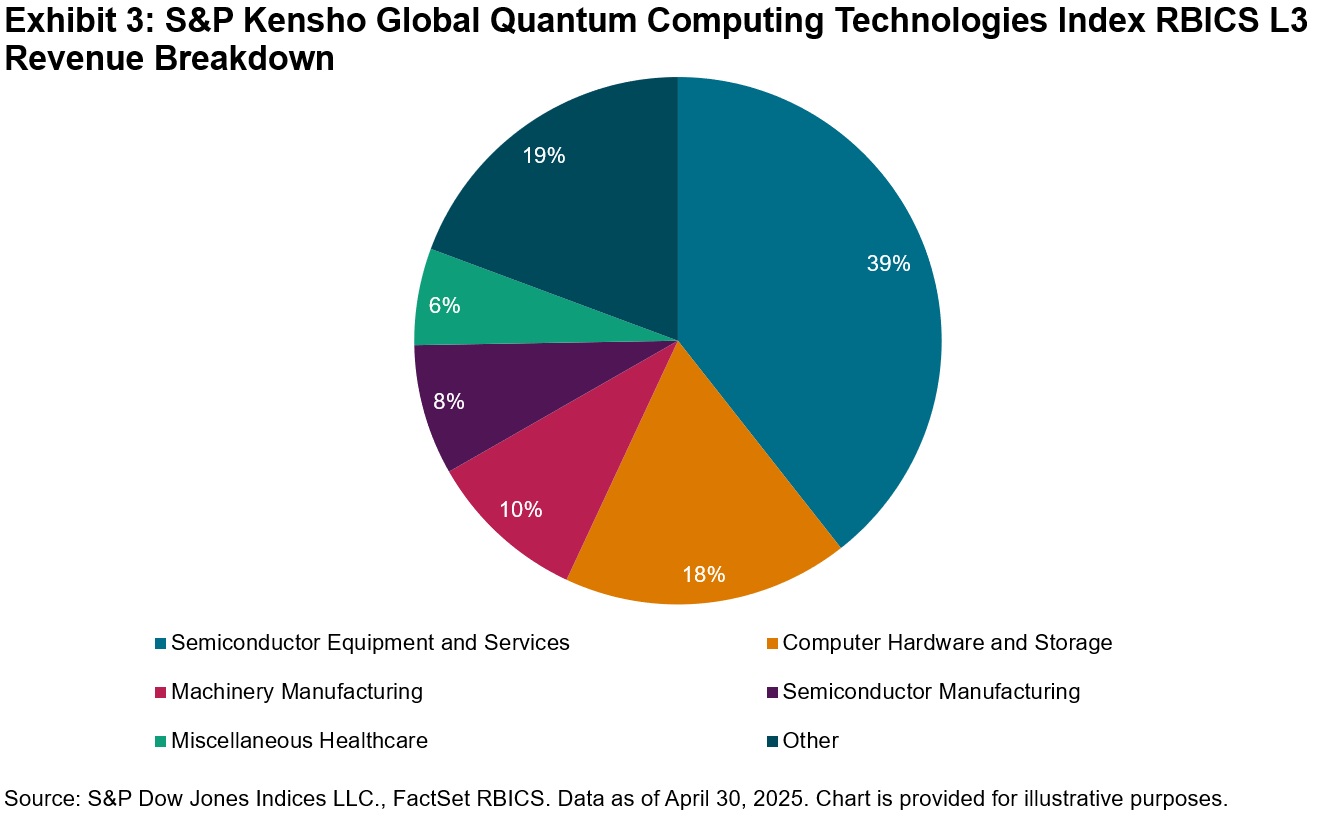
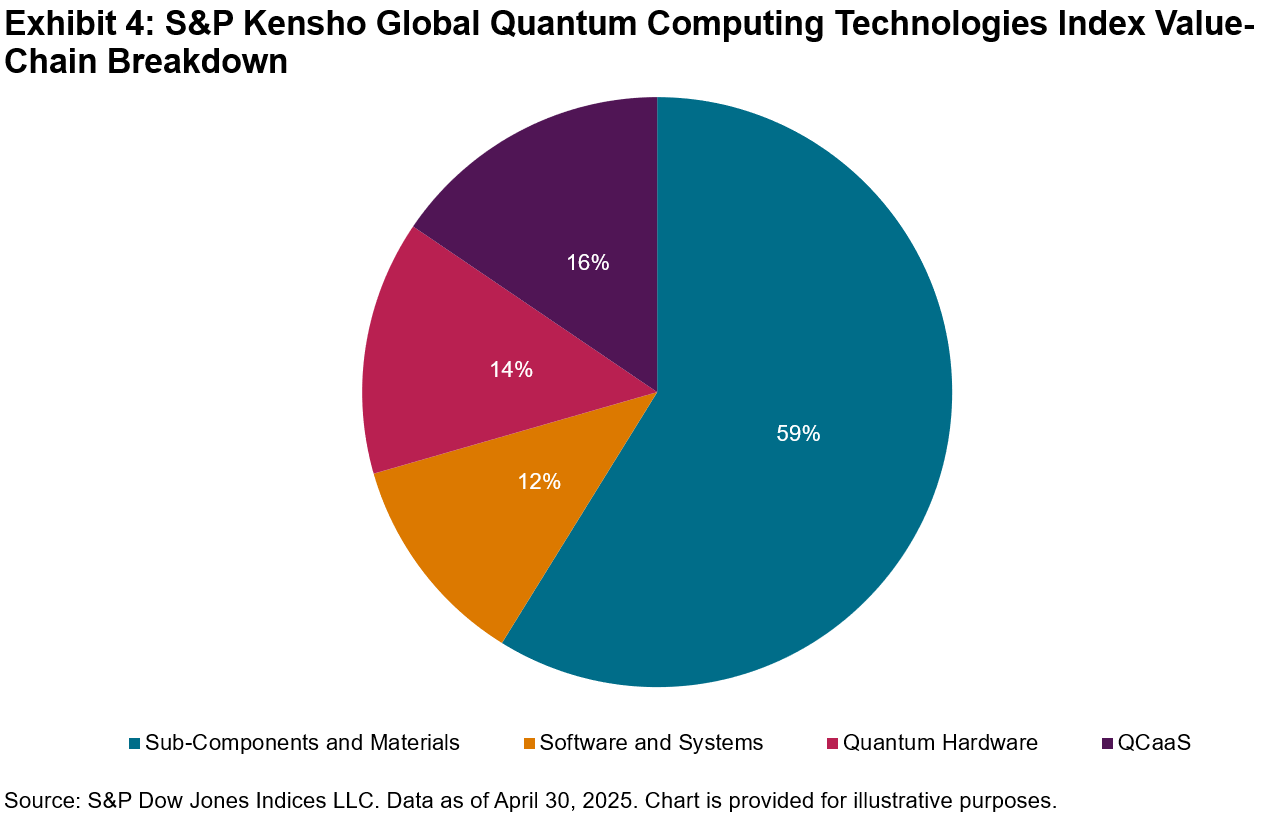
The pie charts in Exhibits 2, 3 and 4 show the breakdown of the S&P Kensho Global Quantum Computing Technologies Index using traditional GICS® industry weights, RBICS revenues and a value-chain analysis, respectively. However, as quantum computing is still a nascent industry, standard approaches still do not reflect it fully.

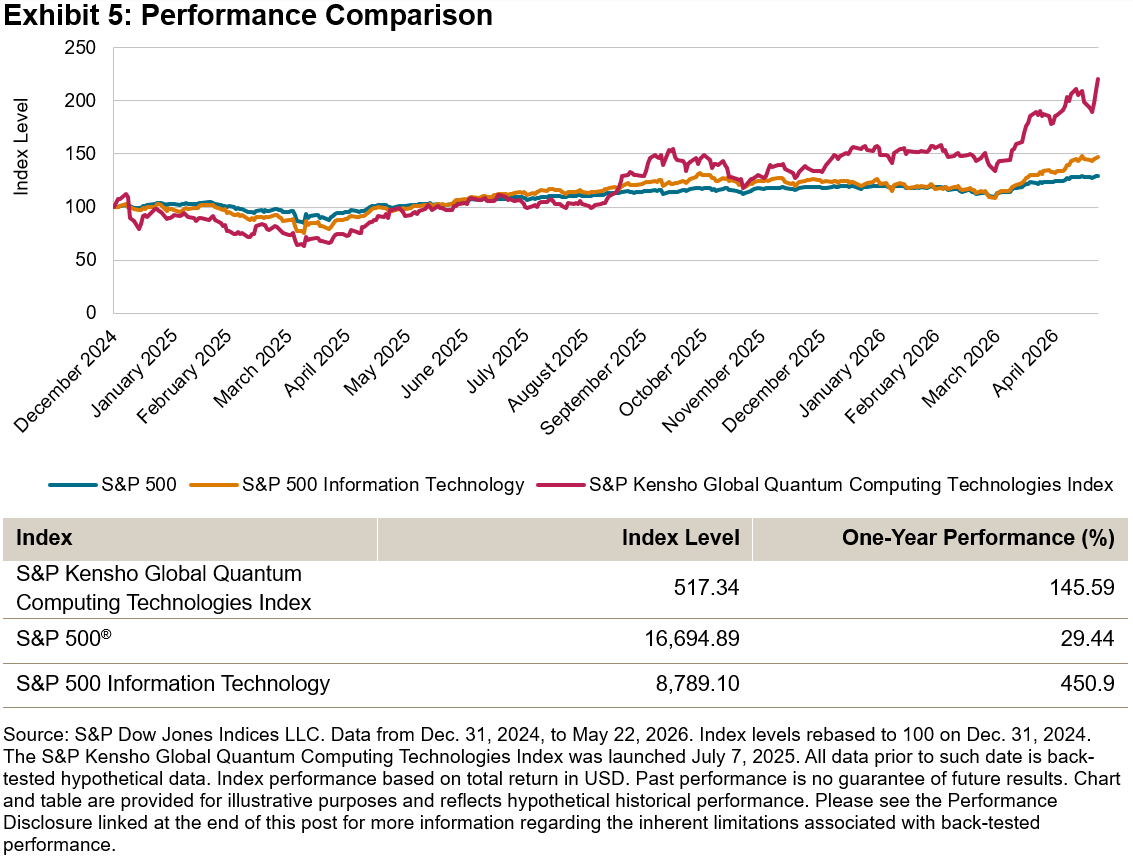
Since its launched on July 7, 2025, the S&P Kensho Global Quantum Computing Technologies Index is up 107%, but the journey has not been smooth. A significant rally in the September-October 2025 period gave way to a range-bound phase through the end of Q1 2026, before the index accelerated again, adding 57% quarter-to-date as of May 22, 2026. Gains have been broad based, with 22 out of 27 constituents contributing positively to one-year performance (see Exhibit 5).

The Backstage Winners

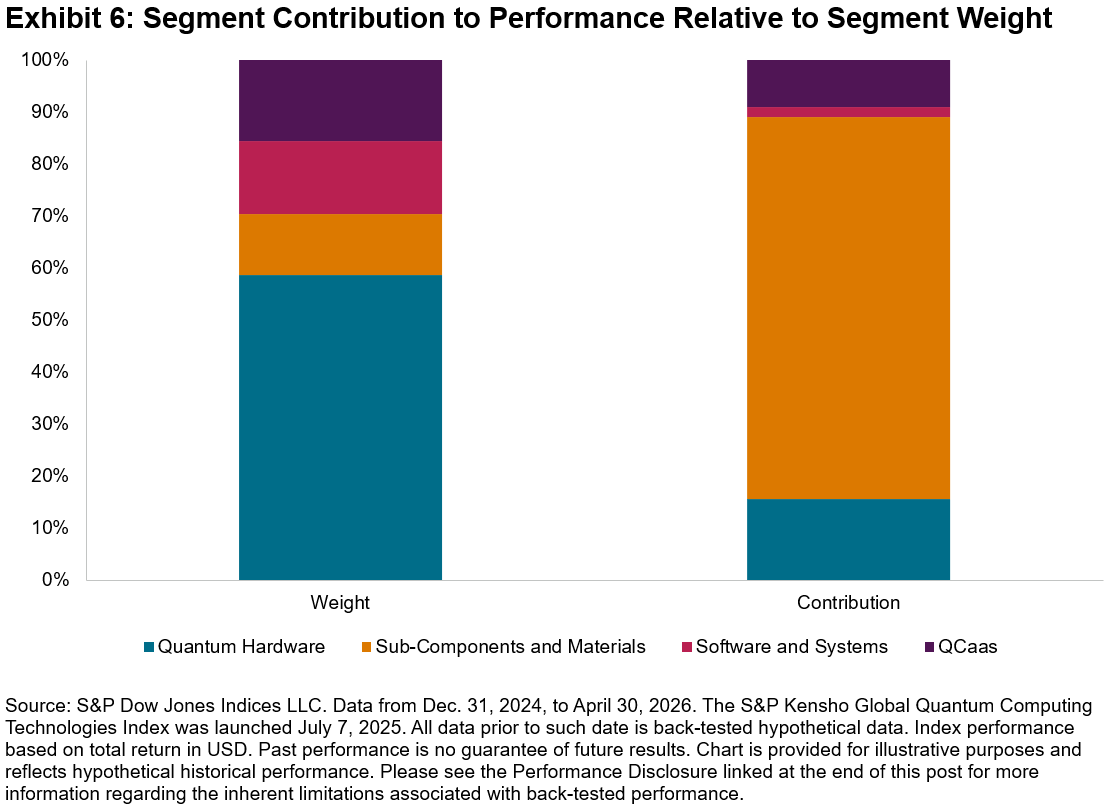
Of the top 10 S&P Kensho Global Quantum Computing Technologies Index contributors, 7 belong to the Sub-Components and Materials segment. As shown in Exhibit 6, this segment represents only 12% of the index’s weight yet has accounted for 73% of overall performance. Quantum Hardware has dominated the index with a weight of 59% but has contributed only 16% to overall performance.

Much of the public narrative around quantum computing is dominated by QCaaS companies such as D-Wave, Rigetti and IonQ—the companies that are generally considered to be the closest to building real world quantum applications. Yet the strongest returns have come from a less visible part of the ecosystem: the companies supplying the components behind the hardware. For example, Soitec provides silicon on insulator wafers critical for advanced chip design;3 FormFactor provides semiconductor test and measurement equipment;4 while Coherent supplies optical components and specialty fiber used in AI data center infrastructure and quantum hardware.5 Each of these companies carries quantum exposure on top of an already strong underlying business tied to AI infrastructure spending, something pure-play quantum names cannot yet claim.

This reflects where quantum computing stands today, still in the infrastructure building phase. The more downstream companies, the QCaaS names and those closest to real world applications, remain more directly tied to the longer-term potential of the technology.

Quantum’s Present Tense

Quantum computing’s story is not waiting to start.6 In cryptography, researchers and government agencies have begun flagging a risk7 known as “harvest now, decrypt later,” where malicious actors collect encrypted data today with the intention of decrypting it once quantum computers are powerful enough to break current encryption standards. It is a threat that is already informing how some governments and enterprises think about long-term data security.

The S&P Kensho Global Quantum Computing Technologies Index will continue to measure the evolution of this technology. Its performance across segments, from Sub-Components to QCaaS, offers a window into how the technology itself is progressing and which stage of the quantum journey is leading the market at any given time.

1   National Institute of Standards and Technology, “Department of Commerce Announces Letters of Intent With 9 Companies for $2 Billion to Accelerate U.S. Leadership in Quantum Computing,” May 21, 2026.

2   Ruane, J., Kiesow, E., Galatsanos, J., Dukatz, C., Blomquist, E., Shukla, P., “The Quantum Index Report 2025,” MIT Initiative on the Digital Economy, Massachusetts Institute of Technology, Cambridge, MA, May 2025.

3   Soitec, “Semiconductors Fabs: Speed and time-to-market acceleration – A global presence.

4   FormFactor, “Press Release,” May 13, 2026.

5   Coherent, “Specialty Optical Fibers.”

6   Hopkins, Brian, “Practical Quantum Computing By 2030 Is Likely — And So Is Q‑Day,” Forrester, March 11, 2026.

7   Mascelli, Jillian and Rodden, Megan, “‘Harvest Now Decrypt Later’: Examining Post-Quantum Cryptography and the Data Privacy Risks for Distributed Ledger Networks,” Board of Governors of the Federal Reserve System, September 2025.

The posts on this blog are opinions, not advice. Please read our Disclaimers.

The Search for Elusive Outperforming Active Funds in Japan

Contributor Image
Sue Lee

APAC Head of Index Investment Strategy

S&P Dow Jones Indices

As readers of our SPIVA® Scorecards know, beating the market is difficult. Finding those few managers capable of doing so consistently may be even harder. Of the 933 active equity funds domiciled in Japan, more than 80% underperformed their respective benchmarks in 2025.1 Yet even among the minority that did outperform, the bigger question remains: how many were able to repeat that success?

If an active manager possesses genuine skill, one would expect their funds to outperform with some consistency over time. However, our research shows that active outperformance tends to be fleeting, regardless of asset class or geography.

Japan was no exception. Based on the universe of funds covered in the SPIVA Japan Scorecard, most of the funds that ranked among the best performers in one period failed to maintain that position in the years that followed. Of the 78 Japanese Large-Cap and 47 Japanese Mid-/Small-Cap funds that placed in the top quartile in 2021, only 8% (including 6 Japanese Large-Cap and 4 Japanese Mid-/Small-Cap funds) remained in the top quartile in each of the four subsequent years. Across the non-domestic equity fund categories examined, not a single fund managed to rank in the top quartile for five consecutive years (see Exhibit 1).

The picture became even starker over longer time horizons. As shown in Exhibit 2, among the top-quartile funds across all reported Japanese fund categories for the five-year period ending in December 2020, only 6% maintained their top-quartile status over the subsequent five-year period, while 61% fell to the bottom quartile or were merged or liquidated.

These shifts were particularly pronounced in domestic equity funds. Only 1% of the top-quartile Japanese Large-Cap funds in 2016-2020 remained in the top quartile in 2021-2025, while 69% dropped to the bottom quartile or were merged or liquidated.

Examining market trends over these two five-year periods may provide some insights into the sharp turnover in fund rankings. Comparing the performance of Japanese sector and factor indices2 between the two five-year periods (see Exhibit 3) reveals meaningful rotations in leadership. For example, the top-performing sectors in 2016-2020—Information Technology, Communication Services and Health Care—all lagged in 2021-2025, while Financials and Energy, which were among the worst-performing sectors in 2016-2020, posted strong outperformance in the subsequent five-year period.

A similar reversal was evident at the factor level. Quality moved from the top of the table in 2016-2020 to the bottom in 2021-2025, while Value, Dividend and Buyback moved in the opposite direction, leading the market in the most recent five years (see Exhibit 3). Taken together, the lack of persistence among active funds and the sharp rotation in market drivers suggest that many active domestic equity managers struggled to adapt to the changing conditions in the Japanese equity market.

Over the recent five-year period, a firm majority of actively managed equity funds in Japan underperformed across all reported categories (see Exhibit 4). While domestic equity funds fared relatively better, with roughly one in four funds outperforming, identifying these outperformers in advance would likely have been difficult, particularly for fund selectors relying on historical fund performance as a guide.

1 Lee, Sue et al., “SPIVA Japan Scorecard Year-End 2025,” S&P Dow Jones Indices LLC, March 9, 2026.

2 See the Index Dashboard: Japan for the list of sector and factor indices in Japan.


The posts on this blog are opinions, not advice. Please read our Disclaimers.

New Tools for Tracking Sector Liquidity

How is index data helping market participants make more informed decisions at the sector level? S&P DJI’s Anu Ganti and Agatha Malinowski discuss how the new Sector Liquidity Monitor in the U.S. Sector Dashboard means investors can now get sector performance, factor exposure, fundamental metrics and liquidity all in one resource to inform sector strategy decisions.

The posts on this blog are opinions, not advice. Please read our Disclaimers.

Harnessing the Power of Multiple Factors: Inside the S&P 500 Quality, Value & Momentum Multi-Factor Index

Contributor Image
Wenli Bill Hao

Director, Factors and Dividends Indices, Product Management and Development

S&P Dow Jones Indices

Single-factor indices have historically outperformed over the long term, but their performance tends to be cyclical, varying with macroeconomic conditions. This has driven demand for multi-factor indices, which combine factors such as quality, value and momentum to leverage their low correlations. By diversifying across multiple factors, these indices seek to enhance long-term risk-adjusted performance and provide more stability.

In this blog, we introduce the S&P 500® Quality, Value & Momentum Multi-Factor Index and explore its construction, review its historical performance, analyze sector composition and assess its factor weights to provide a comprehensive overview of its characteristics.

YTD Outperformance

The S&P 500 Quality, Value & Momentum Multi-Factor Index outperformed the S&P 500 in Q1 and YTD 2026 (see Exhibit 1). Despite increased volatility in Q1, it proved resilient, outperforming the S&P 500 by about 9%. As markets rebounded from March lows, the multi-factor strategy maintained its outperformance, while indices like the S&P 500 Enhanced Value Index lagged.

Methodology Overview

The S&P 500 Quality, Value & Momentum Multi-Factor Index uses a bottom-up approach, selecting the top 20% of S&P 500 stocks based on a composite multi-factor score1 (see Exhibit 2). This score averages individual quality, value and momentum scores, targeting a concentrated group of “all-rounders”—stocks that exhibit strength across multiple factors.

Constituents are weighted by the product of their market capitalization and multi-factor score, balancing size and factor strength.2 The index is rebalanced semiannually in June and December to maintain its targeted multi-factor scores and adapt to changing market conditions.

Harnessing Complementary Factors

Factor combinations are generally grounded in economic rationale. Quality, value and momentum have historically tended to respond complementarily across different phases of the business cycle: quality is defensive and tends to outperform during economic slowdowns; value is procyclical, performing well during recoveries; and momentum benefits from persistent market trends. As shown in Exhibit 3, the excess performance of the S&P 500 Quality Index, S&P 500 Enhanced Value Index and S&P 500 Momentum Index exhibited low or even negative correlations, underscoring their diversification potential.

Performance Comparison

The S&P 500 Quality, Value & Momentum Multi-Factor Index consistently outperformed the benchmark over both short and longer back-tested horizons, in total and risk-adjusted performance. It also exhibited greater resilience than single-factor strategies, as evidenced by the performance hit ratio and capture ratios (see Exhibit 4), highlighting the historical advantage of combining complementary factors to reduce cyclicality.

Sector Composition

Exhibit 5 shows the sector weights of the S&P 500 Quality, Value & Momentum Multi-Factor Index versus the S&P 500. The S&P 500 Quality, Value & Momentum Multi-Factor Index has historically overweighted Consumer Staples, Energy, Financials and Industrials, while underweighting Information Technology and Communication Services. This sector tilt contributes to the index’s distinct risk and performance profile compared to the S&P 500.

Factor Z-Scores

Exhibit 6 highlights the factor Z-score differences between the S&P 500 Quality, Value & Momentum Multi-Factor Index and the S&P 500, using FactSet Risk Model Z-scores. As expected, the S&P 500 Quality, Value & Momentum Multi-Factor Index had higher Z-scores in quality (higher profitability and lower leverage), value (earnings yield and the book-to-price ratio) and momentum. It also shows spill-over into lower beta and lower volatility.

Conclusion

The S&P 500 Quality, Value & Momentum Multi-Factor Index showcases a diversified approach that can help with navigating varying market conditions. By blending complementary factors, the index aims to enhance risk-adjusted performance and reduce cyclicality, providing an alternative to traditional single-factor or market-cap-weighted strategies.

1 Andrew Innes, “The Merits and Methods of Multi-Factor Investing,” S&P Dow Jones Indices LLC, April 2018.

2 For more detailed information, please refer to the S&P 500 Quality, Value & Momentum Multi-Factor Indices Methodology.

The posts on this blog are opinions, not advice. Please read our Disclaimers.

S&P Global Dividend Aristocrats in Focus: S&P World Ex-Australia High Yield Dividend Aristocrats Select Index

How are dividend indices helping income seekers around the world make more informed decisions? S&P DJI’s Jason Ye joins ausbiz’s Andrew Geoghegan for a closer look at what it takes to be a Dividend Aristocrat and how the S&P World Ex-Australia High Yield Dividend Aristocrats Select Index tracks quality dividend growers. 

The posts on this blog are opinions, not advice. Please read our Disclaimers.