Get Indexology® Blog updates via email.

In This List

Beyond Bitcoin – The Allocator Perspective: Why Digital Asset Benchmarking Is Entering a New Era

Liquidity in Latin American Equity Markets: A Tale of Two Trends

Tracking Shareholder Yield with Indices

The Anatomy of Resilience: The S&P 500 Resilient Shareholder Yield Index

Beyond Bitcoin – The Manager Perspective: Why Digital Asset Benchmarking Is Entering a New Era

Beyond Bitcoin – The Allocator Perspective: Why Digital Asset Benchmarking Is Entering a New Era

Contributor Image
Sherifa Issifu

Associate Director, Global Exchanges

S&P Dow Jones Indices

In the previous webinar wrap-up, we discussed the manager perspective; here, we take a look at the allocator perspective and the index provider response to a maturing market and the institutional market’s requirements for better benchmarks.

The ETF Effect: Bitcoin Beta Has Become Cheaper

If Bitcoin is an imperfect benchmark, it remains an unavoidable one for a different reason: it may now be considered the clearest expression of cheap, accessible crypto beta.

Chris Solarz framed the issue from the allocator’s perspective. For him, benchmarking is the prerequisite for identifying alpha, because outperformance only has meaning relative to a credible alternative. And that alternative has changed materially since the arrival of spot Bitcoin ETFs. Solarz noted that Bitcoin exposure can now be obtained at low cost—he cited fee competition driving ETF pricing down to as little as 14 bps.1

That has major implications for active managers. If investors can access core crypto beta passively and cheaply, then the justification for paying hedge fund-style fees rests on true excess return, not simply exposure to a rising market. Solarz put it plainly: the only thing investors should pay for is alpha. If net returns are not above what could have been achieved through a passive index or ETF, then the value proposition of active management becomes difficult to defend.

This is one of the webinar’s most important institutional takeaways: the commoditization of beta is leading to more precise conversations about what active crypto managers actually do. That is healthy for the market, but it may raise the bar considerably.

A More Segmented Way to Measure Crypto Funds

Solarz’s solution is not to abandon broad reference points, but to use a more segmented framework. When evaluating liquid digital asset managers, he starts with four benchmarks:

This approach recognizes that digital assets are not one homogeneous pool of risk. Bitcoin remains the dominant reference asset; Ethereum reflects a distinct smart-contract and ecosystem; Solana increasingly represents another major asset and the remaining altcoin universe requires its own lens.

This framework helps allocators ask sharper questions. Is a manager outperforming because they generated security selection alpha? Because they made a successful allocation call across crypto subsegments? Or because they simply maintained exposure to the best-performing beta bucket?

Solarz was also candid that no single framework fully resolves the issue. Institutional committees will still ask the obvious question: why not just own Bitcoin? That remains a fair opportunity-cost benchmark, especially for investors starting from zero. But he argued that relying on Bitcoin alone may do an injustice to the complexity of the asset class, where sectors such as DeFi, payments, gaming, metaverse and other subsectors can behave very differently.

In other words, Bitcoin may still be a starting point, but it may no longer be the end of the conversation.

Why Building Indices in Crypto Is Harder than It Looks

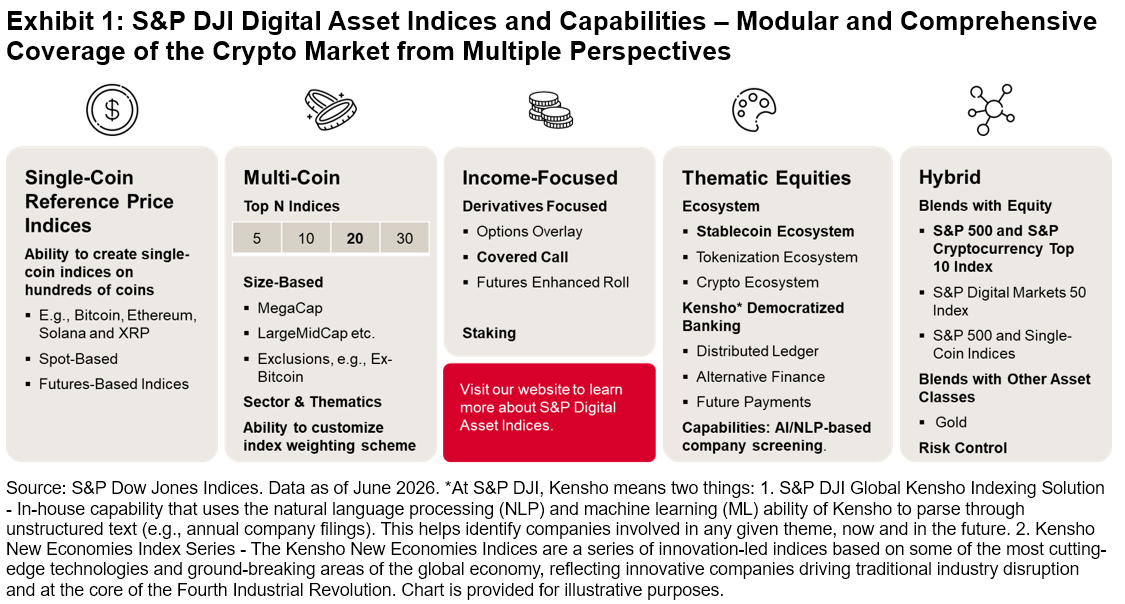
Rounding out the discussion with the index provider’s perspective, S&P Dow Jones Indices (S&P DJI) approaches the market through several lenses: single-coin indices, multi-coin strategies, crypto-linked equity indices and hybrid cross-asset benchmarks that blend digital assets with traditional asset classes.

Even apparently simple questions like the following can become complex in this market.

  • How should the price of a single token be constructed?
  • Which exchanges should be used in the pricing methodology?
  • What qualifies as large cap, mega cap or broad market in crypto?
  • Should an index be purely market-cap weighted, equal weighted, capped or filtered?
  • How should benchmark construction adapt as market concentration changes over time?

Index names alone never tell the full story. Methodology matters. Definitions matter. And in a market as dynamic as crypto, those definitions can change quickly as market structures evolve. At S&P DJI, we offer a range of digital asset solutions for different market objectives.

Learn more about our capabilities and view the full webinar replay.


1 As of the time of the webinar. For more information, please see Daodu, Sam, “Bitcoin News: Morgan Stanley Just Launched the Cheapest Bitcoin ETF on the Market,” Yahoo Finance, April 11, 2026.

The posts on this blog are opinions, not advice. Please read our Disclaimers.

Liquidity in Latin American Equity Markets: A Tale of Two Trends

Contributor Image
Hector Huitzil

Senior Analyst, Global Equity Indices

S&P Dow Jones Indices

During recent years, Latin American flagship indices have exhibited strong performance, surpassing the gains of the broader emerging markets segment: in local currency terms, the S&P Latin America BMI has posted 10.0% annualized performance over the past five years, while the S&P Emerging BMI has trailed with 7.7% annualized performance. During this period, all local flagship benchmarks of the region have also outperformed the emerging markets benchmark, including the S&P/BMV IRT for Mexico (up 10.9%), S&P Colombia Select Index for Colombia (up 19.3%), S&P IPSA for Chile (up 19.5%) and S&P Peru Select 20% Capped Index for Peru (up 24.3%). Performance such as this would be expected to be translated into increased liquidity in the local markets. In this blog post we are going to explore how liquidity has behaved in the same period.

Measuring market liquidity can be challenging, as the liquidity of constituents is highly correlated with market capitalization, and some measures such as the average can be influenced by extreme values; an increase in liquidity among the largest constituents can raise the index average and suggest improved liquidity conditions, even as a majority of constituents experience tighter conditions.

To analyze this subject, we use the 12-month median daily value traded (MDVT)1—a measure that is more robust than the average with regard to the presence of extreme values—and analyze its evolution in the previously mentioned flagship indices (see Exhibit 1). For each market, we include both the median and average 12-month MDVT alongside the component with the highest liquidity (represented by the blue dotted line), while the gray shaded area signals the liquidity measure for 80% of the constituents between the 10th and 90th percentiles.

While the average liquidity has risen in Mexico, Peru and Chile, suggesting improved liquidity in these markets, median liquidity has declined in all markets except for Chile. This difference can be explained at least partially by the fact that the most liquid constituent in each index, (shown in blue) is far more liquid than all other constituents—even compared to the second-most liquid name—and this gap has widened over time. This difference is most pronounced in Peru, where Southern Copper Corporation (listed outside of the region) had a 12-month MDVT that is two orders of magnitude above the median.

Liquidity conditions also differ considerably across countries: Mexico showed the highest median liquidity, while Peru lagged the rest of the region, even with the presence of the most liquid constituent in the region.

Conditions in the region remain challenging, with liquidity improvements concentrated in a small number of large-cap companies, while the rest of the market experiences tightening conditions even as regional performance surpasses other emerging markets. Depreciation of exchange rates could influence the measured liquidity, but overall, a differentiated trend toward concentration of liquidity in large names remains visible.

112-Month MDVT is defined as the median of the daily value traded for a company over the past 12 months. The value traded is calculated by multiplying the number of shares traded by each stock’s price.

The posts on this blog are opinions, not advice. Please read our Disclaimers.

Tracking Shareholder Yield with Indices

How can a disciplined capital return strategy influence performance? Get to know the S&P 500 Resilient Shareholder Yield Index. 

The posts on this blog are opinions, not advice. Please read our Disclaimers.

The Anatomy of Resilience: The S&P 500 Resilient Shareholder Yield Index

Contributor Image
Elizabeth Bebb

Director, Factor & Dividend Indices

S&P Dow Jones Indices

Equity markets have experienced volatility YTD, with Q1 2026 drawdowns driven by geopolitical uncertainty and stretched valuations giving way to a strong rebound in April and May. Amid these market swings, the S&P 500® Resilient Shareholder Yield Index has stood out.

Shareholder yield combines dividends, share buybacks and net debt reduction into a single metric that measures the various ways companies distribute value to investors. The S&P 500 Resilient Shareholder Yield Index focuses on companies that return significant capital to shareholders while maintaining balance sheet strength and cash flow discipline.

YTD Outperformance

In Q1 2026, the S&P 500 Resilient Shareholder Yield Index demonstrated its defensive qualities by outperforming the S&P 500 by more than 10%. Although the broader market has since rebounded, the index has maintained a solid lead, outperforming the S&P 500 by 5.63% YTD.

Q1 2026 Performance Attribution

Exhibit 3 presents the performance attribution for Q1 2026, highlighting the top contributors. The results show that overall performance was primarily driven by stock selection, with sector effects also playing a role.

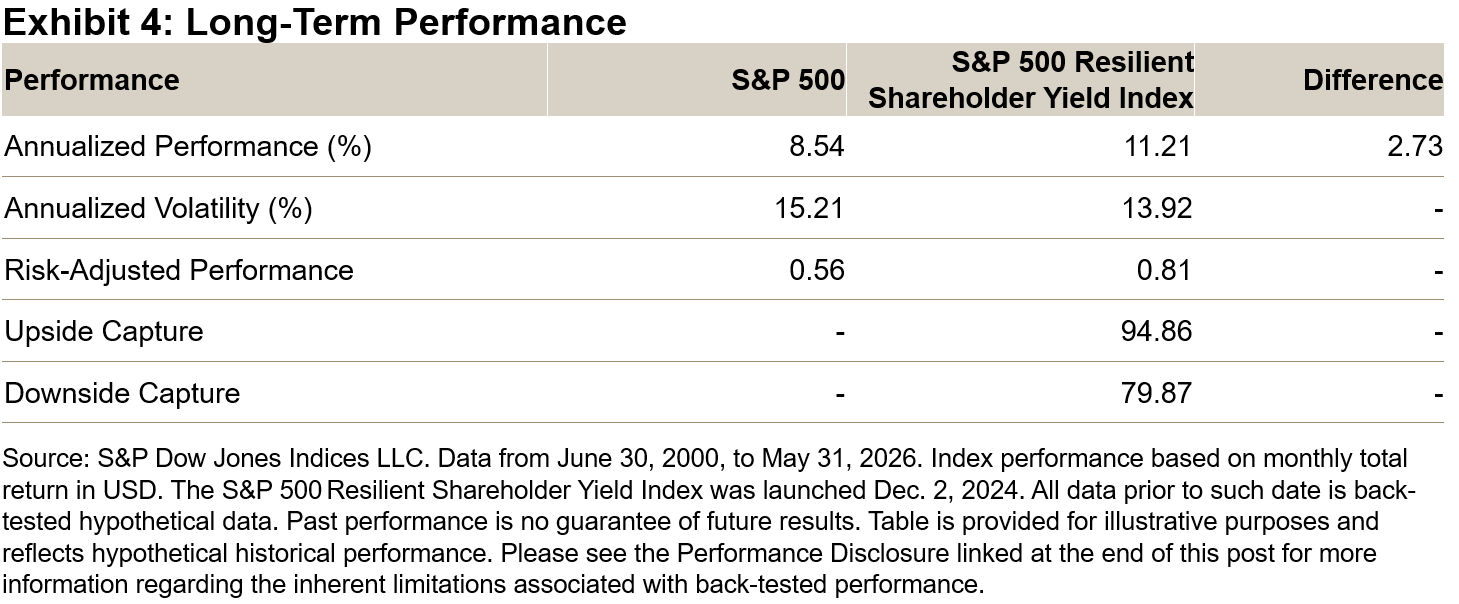
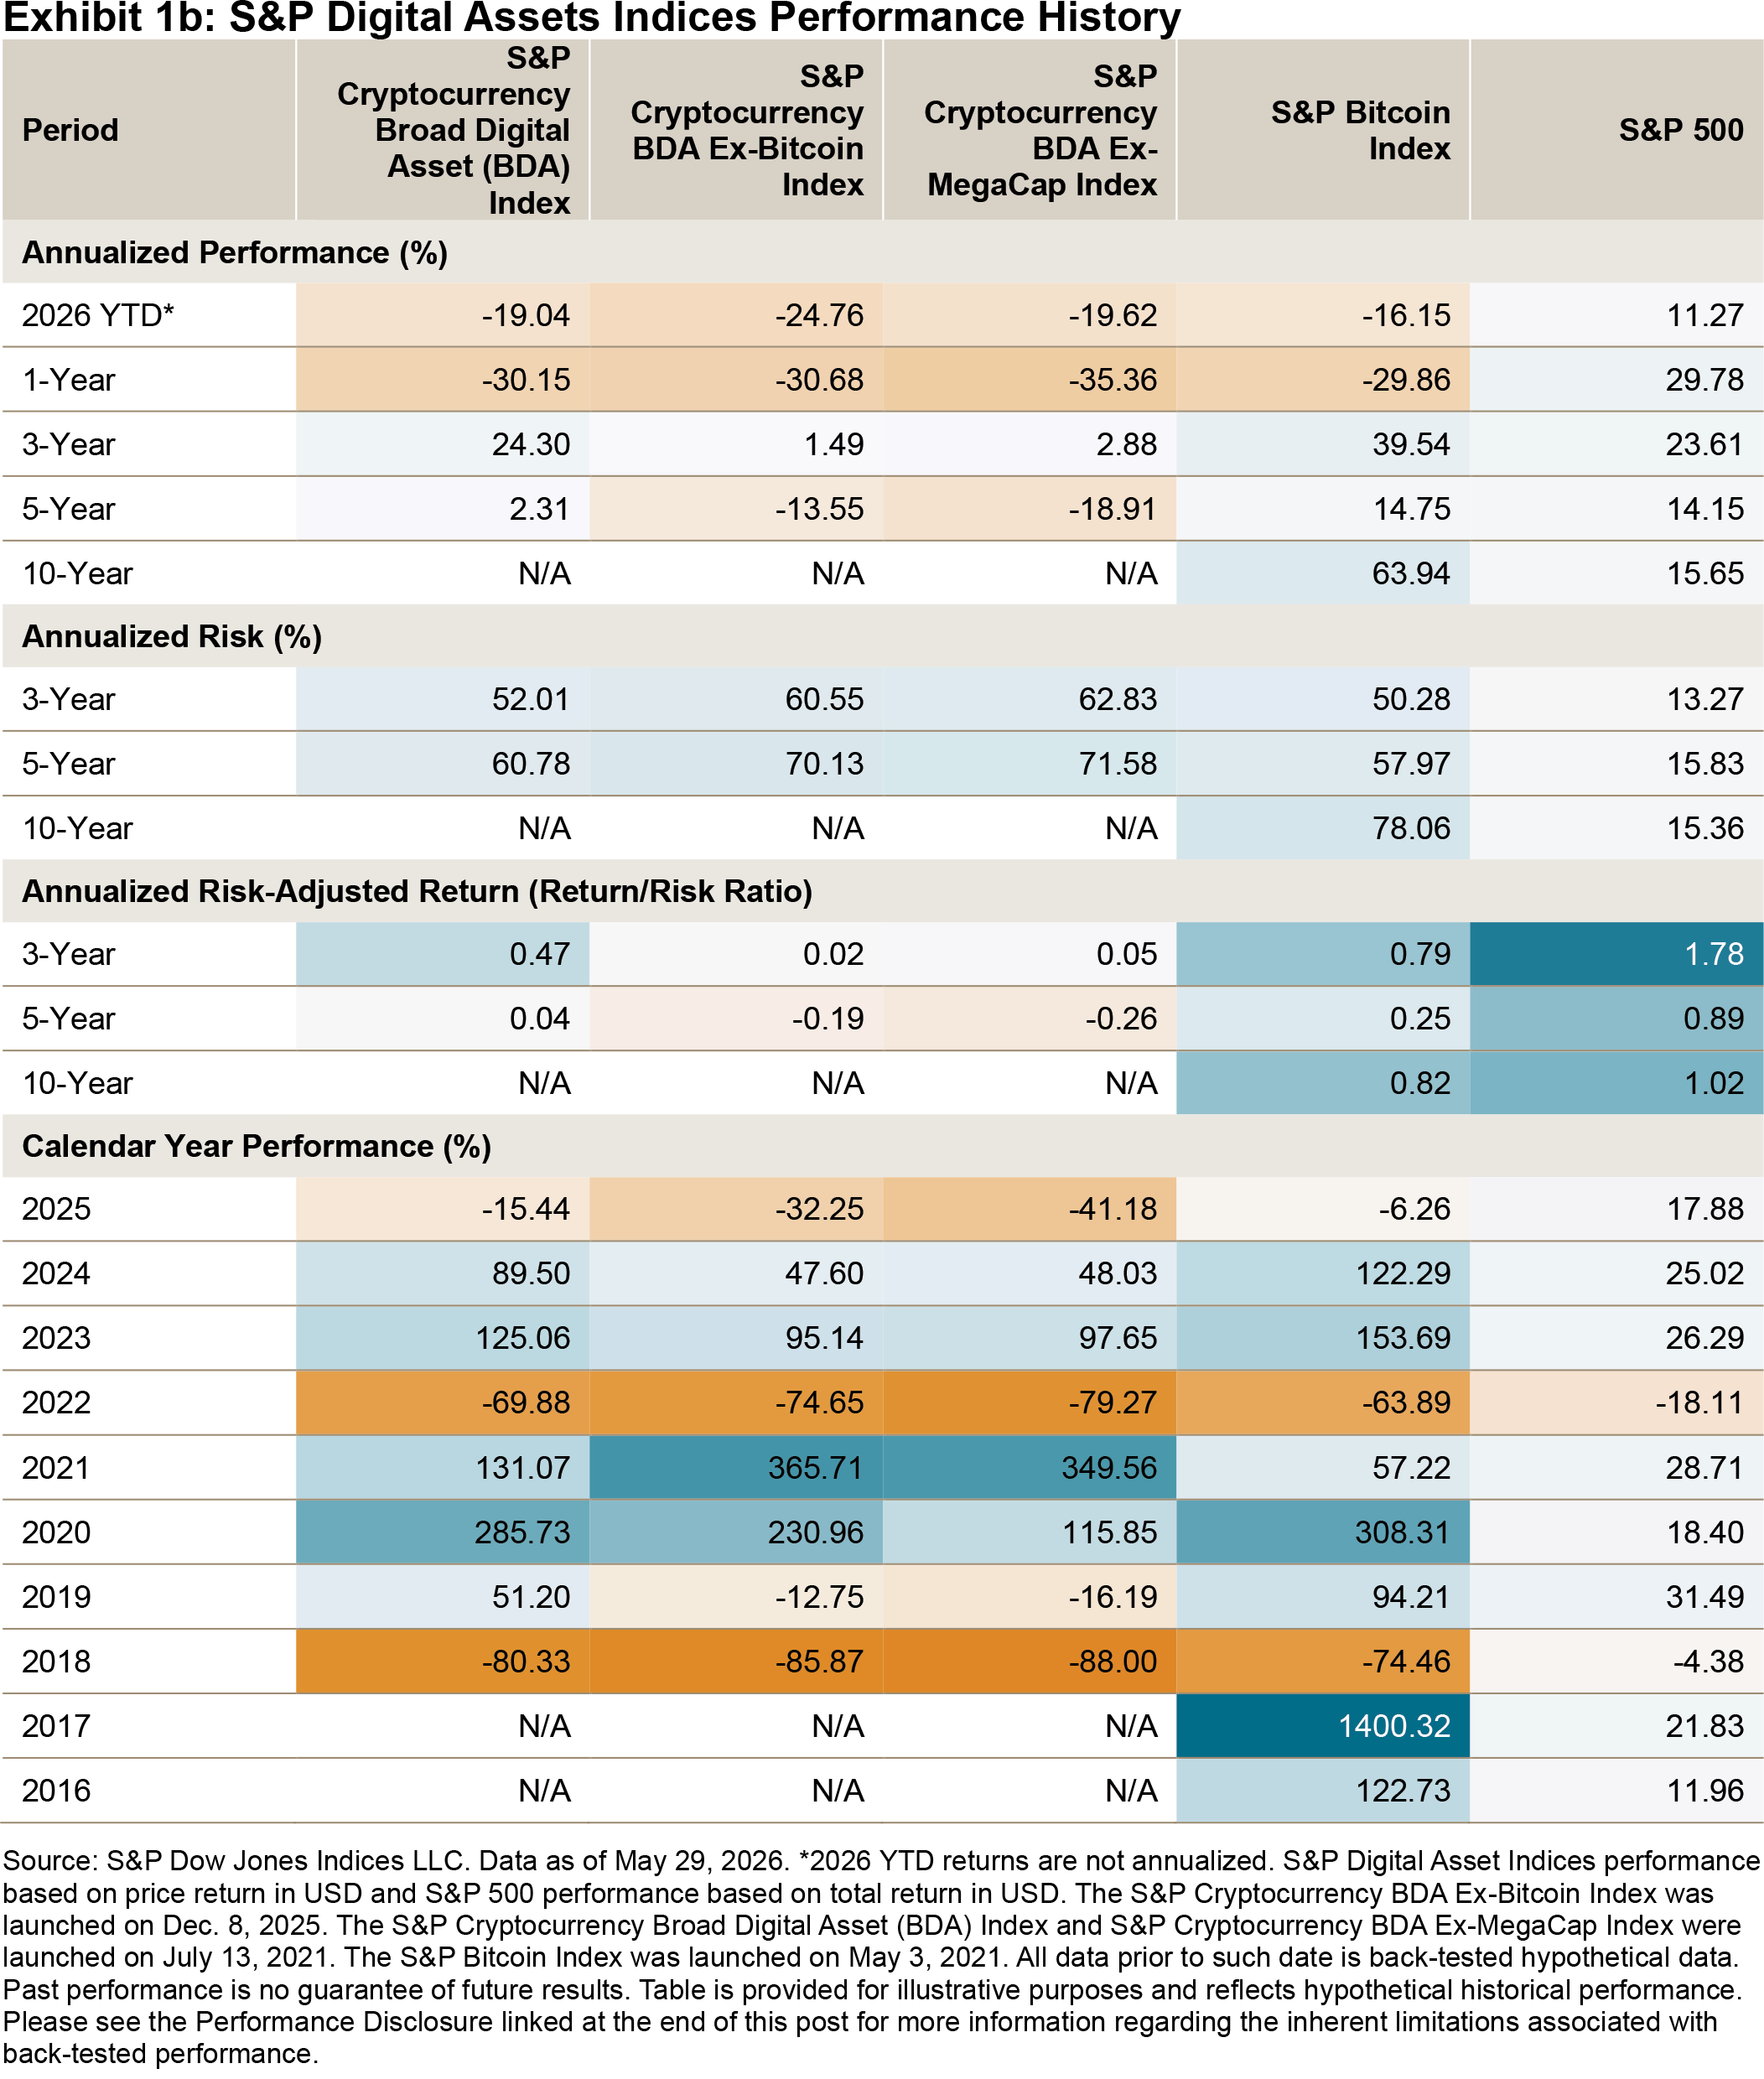
Long-Term Performance Characteristics

Over the longer term, back-testing indicates that the S&P 500 Resilient Shareholder Yield Index outperformed the S&P 500 by 2.7% annualized since June 2000, with lower volatility and reduced downside capture. Notably, these defensive qualities have not come at the expense of upside participation—the index has tended to perform well during months when the S&P 500 delivered positive performance.

Drawdown Behavior

The index’s focus on capital return and balance sheet strength has translated into lower drawdowns in several major market stress events, including the tech bubble, the COVID-19 sell-off and the 2022 inflation shock. The index has historically shown greater resilience during periods of prolonged market stress.

Historical Macroeconomic Performance

Historically, the strongest relative performance has tended to occur during periods of slowing growth and rising inflation. In these environments, income, valuation discipline and lower volatility have been more consistently rewarded—aligning with the index’s emphasis on shareholder yield and quality.

Conclusion

The S&P 500 Resilient Shareholder Yield Index reflects a disciplined approach that prioritizes sustainable capital return and financial resilience rather than dividend yield alone. By combining shareholder yield with quality and balance sheet metrics, the index has historically outperformed the broad market benchmark during periods of market stress and recovery.


1 Free cash flow (FCF) comprises operating cash flow minus capital expenditure.

2 Methodology is available at: https://www.spglobal.com/spdji/en/methodology/article/sp-500-shareholder-yield-indices-methodology/

3A Historical Perspective on Factor Index Performance across Macroeconomic Cycles,” S&P Dow Jones Indices.

The posts on this blog are opinions, not advice. Please read our Disclaimers.

Beyond Bitcoin – The Manager Perspective: Why Digital Asset Benchmarking Is Entering a New Era

Contributor Image
Sherifa Issifu

Associate Director, Global Exchanges

S&P Dow Jones Indices

As institutional capital moves deeper into digital assets, one question is becoming increasingly relevant: what, exactly, should crypto fund managers be measured against?

That was the central issue in a recent webinar, “Benchmarking Digital Asset Funds: Are Managers Measuring Performance Effectively?” hosted by Crypto Insights Group with participation from S&P Dow Jones Indices (S&P DJI), Amitis Group and Syncracy Capital. The discussion brought together the perspectives of S&P DJI, an index provider with a range of S&P Digital Asset Indices, an active manager and a fund allocator—offering a useful snapshot of how institutional standards are beginning to form in a market that still lacks a universally accepted playbook.

The panel featured Andy Martinez, CFA, CEO of Crypto Insights Group; Sherifa Issifu of S&P Dow Jones Indices; Ryan Watkins, CIO of Syncracy Capital; and Chris Solarz, CIO of Amitis Group. Together, they explored three issues that increasingly define institutional crypto investing: what should be benchmarked, how should alpha be defined, and what makes a benchmark credible in a fast-evolving asset class?

The Core Problem: Finding a Benchmark Fit for the Fund Strategy

Our host Andy Martinez opened the session with a practical observation from Crypto Insights Group’s work with both managers and allocators: benchmarking is one of the most persistent friction points in digital asset investing. More than 60% of managers surveyed by the firm said their biggest challenge was simply finding a benchmark that fit their mandate, while the next biggest challenge was getting limited partners (LPs) comfortable with the benchmark they had selected.

That challenge matters because benchmarking is not a cosmetic exercise. It shapes how managers present performance, how allocators judge skill and ultimately how capital gets allocated. In traditional markets, exposure and comparison sets are relatively well understood. In digital assets, by contrast, many strategies are still being compared against benchmarks that do not reflect the exposures they actually contain.

A recurring example is the industry’s anchoring performance back to Bitcoin (a proxy is the S&P Bitcoin Index), even when a strategy has little or no Bitcoin exposure, or in some cases the use of an equity benchmark like the S&P 500®. As Martinez noted, this creates a distorted evaluation framework—particularly now that institutions can access Bitcoin beta cheaply through ETFs. If the benchmark does not reflect the real opportunity set, it becomes difficult to tell whether returns came from market exposure, manager skill or simply the framing of the comparison.

Why Bitcoin Is No Longer a Sufficient Universal Benchmark

Ryan Watkins made perhaps the clearest case for moving beyond a one-size-fits-all Bitcoin benchmark. Syncracy Capital runs a long-biased digital asset hedge fund focused on the top end of the crypto market excluding Bitcoin, with an emphasis on identifying long-term category leaders across different segments of the crypto economy.

Watkins argued that benchmarking such a strategy to Bitcoin is fundamentally misleading. His analogy was straightforward: it is like benchmarking an equities hedge fund against gold. In his view, Bitcoin behaves more like a monetary asset or digital gold, while much of the rest of the digital asset universe increasingly resembles equity-like exposure to application layers, protocols and growth themes.

That distinction matters because relative performance can become deeply distorted. In years when Bitcoin rallies sharply, managers focused on altcoins or broader digital asset themes may appear to underperform even if they are executing well within their mandate. In other periods, the reverse may happen, creating the illusion of skill where none exists.

Watkins also emphasized that the very term “cryptocurrency” obscures the diversity of the market. Most tokens are not designed to function primarily as currencies. Instead, allocators are increasingly underwriting exposure to areas such as stablecoins, prediction markets, tokenization and other application-specific segments of the crypto economy. That broadening opportunity set makes a single-asset benchmark even less defensible as the default reference point.

To better align measurement with mandate, Watkins said Syncracy Capital uses an S&P DJI benchmark—the S&P Cryptocurrency BDA Ex-MegaCap Index—that excludes the mega caps, specifically Bitcoin and Ethereum, as a more representative proxy for the part of the market in which the fund actually invests.

In Exhibit 1, we show the performance of the S&P Cryptocurrency Broad Digital Asset (BDA) Index versus the S&P Cryptocurrency BDA Ex-MegaCap Index. The past year has highlighted the stark difference in behavior and performance characteristics between the S&P 500 and cryptocurrency indices, across indices that both include and exclude Bitcoin. 2025 and 2026 have highlighted the importance of looking under the hood of digital asset indices.

Learn more about our capabilities and view the full webinar replay.

The posts on this blog are opinions, not advice. Please read our Disclaimers.