Get Indexology® Blog updates via email.

In This List

Deciphering the S&P Digital Markets 50 Index

Introducing the S&P/B3 VIX Futures Index: A New Benchmark for Brazilian Equity Market Volatility

Is It Value? Is It Growth? The International Financials Sector Can Now Be Both

Navigating Fixed Income in a Changing Market: S&P/ASX iBoxx Australian & State Governments 0+ Index

Exploring Growth at a Reasonable Price: S&P/ASX 200 GARP Index

Deciphering the S&P Digital Markets 50 Index

Contributor Image
Sherifa Issifu

Associate Director, Global Exchanges

S&P Dow Jones Indices

The Crypto Ecosystem and Digital Asset Index Landscape

As digital assets continue to move into the institutional mainstream, investors are increasingly looking for ways to gain exposure to the space in a holistic way that considers all parts of the crypto value chain, from equities to digital assets. The S&P Digital Markets 50 Index is a hybrid benchmark that combines listed companies tied to the crypto ecosystem with direct exposure to major digital assets. This cross-asset approach provides broader access to the blockchain economy than digital assets alone.

Methodology of the S&P Digital Markets 50 Index1

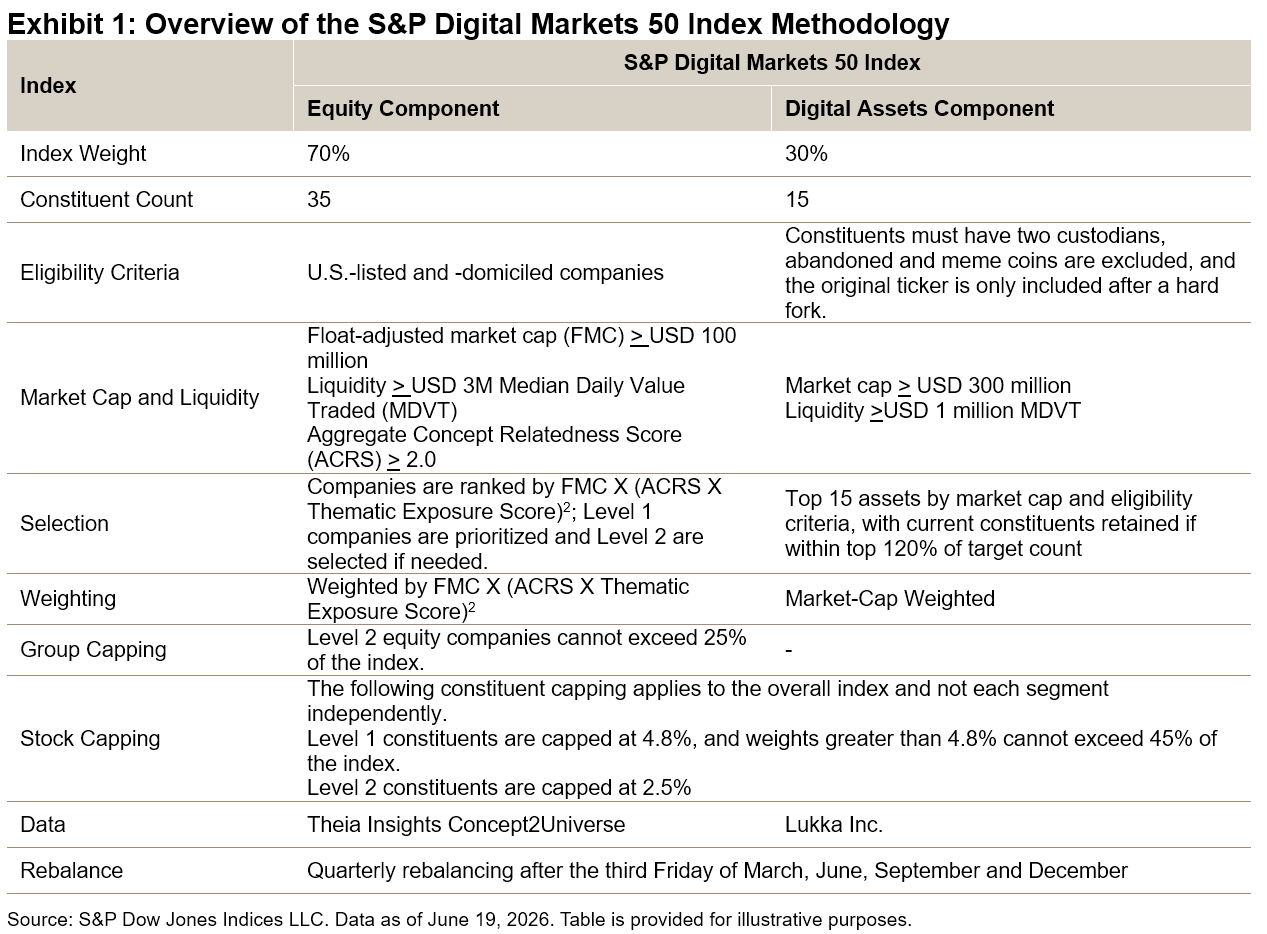
Looking at how the index is constructed, the equity portion constitutes 70% of the index and is made up of 35 U.S.-listed and -domiciled public companies from the S&P Global BMI that are involved in crypto and digital asset infrastructure (operators, infrastructure providers, financial services, blockchain applications and supporting technologies). These companies build the infrastructure and services that are central to the digital transformation, spanning areas including exchanges, custody, payments, on-ramps, analytics, hardware and institutional rails.

The digital assets portion comprises 30% of the index and is made up of 15 cryptocurrencies selected from the S&P Cryptocurrency Broad Digital Asset (BDA) Index. The inclusion of native protocols and assets like Bitcoin highlights the latter’s status in the crypto market as the largest asset, often given the moniker “digital gold.” Ethereum and Solana represent the use of protocols as Layer 2 networks and platforms, where much of the infrastructure for tokenization and trading is being built. Bitcoin and Ethereum are categorized as Level 1 crypto assets and individually capped at 5%, while all other crypto assets in the index are individually capped at 2.5%.

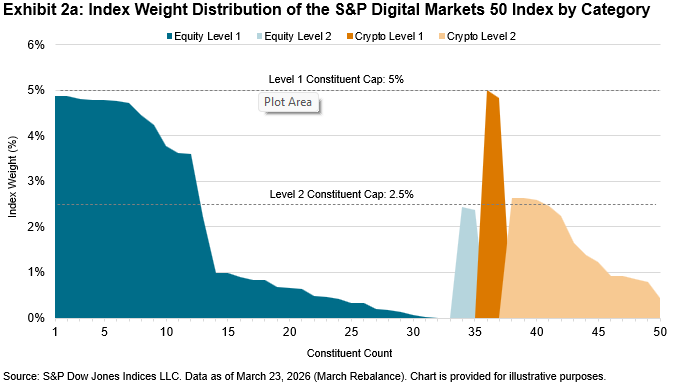
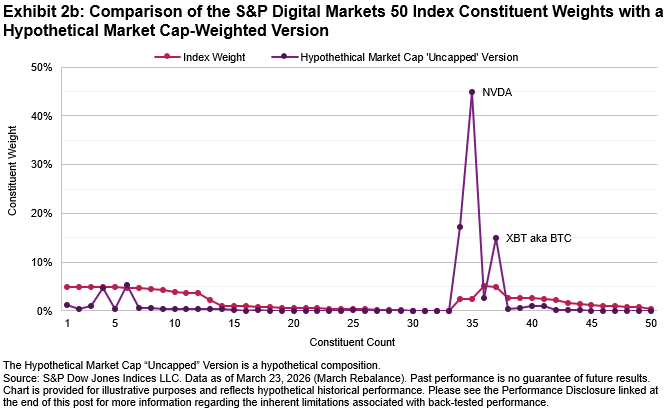
At the heart of the index is having a mixed representation of constituents and striking a balance between the equity and digital asset components, while also considering the weights of companies that are highly related to the crypto ecosystem (which we refer to as Level 1) and those that are somewhat related and contribute to the theme (which we refer to as Level 2). Level 1 companies with higher crypto ecosystem relatedness are capped at 5% to allow weight for other emerging Level 1 companies that may have a lower market cap and support the diversification of the index. Level 2 companies, which may have some involvement in DeFi, but a lower level, are capped at 2.5% at rebalance but have some runway intra-quarter. This can be valuable, ensuring that mega-cap companies like Alphabet (Google) and Nvidia—which have some involvement in crypto—do not dominate the index compared as they may with a market cap-weighted approach.

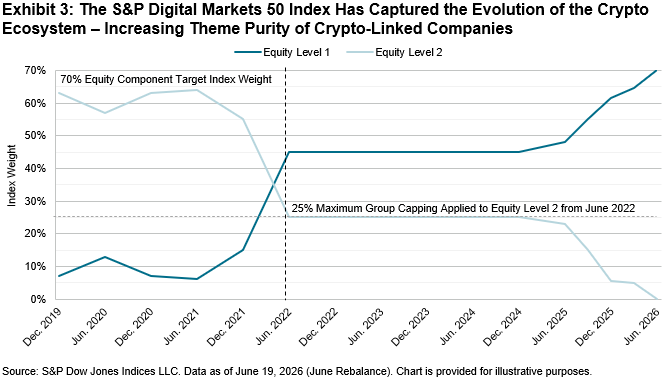
With the growing number of crypto-related companies, the index’s equity component dropped Nvidia and Google during the June rebalance, with the theme purity of the equity segment increasing over time. As the crypto ecosystem develops, the “purity” of companies represented in the S&P Digital Markets 50 Index has increased over time when looking at changes to the composition of Level 1 and Level 2 companies, as shown in Exhibit 3.

Performance of the S&P Digital Markets 50 Index Compared to Relevant Benchmarks

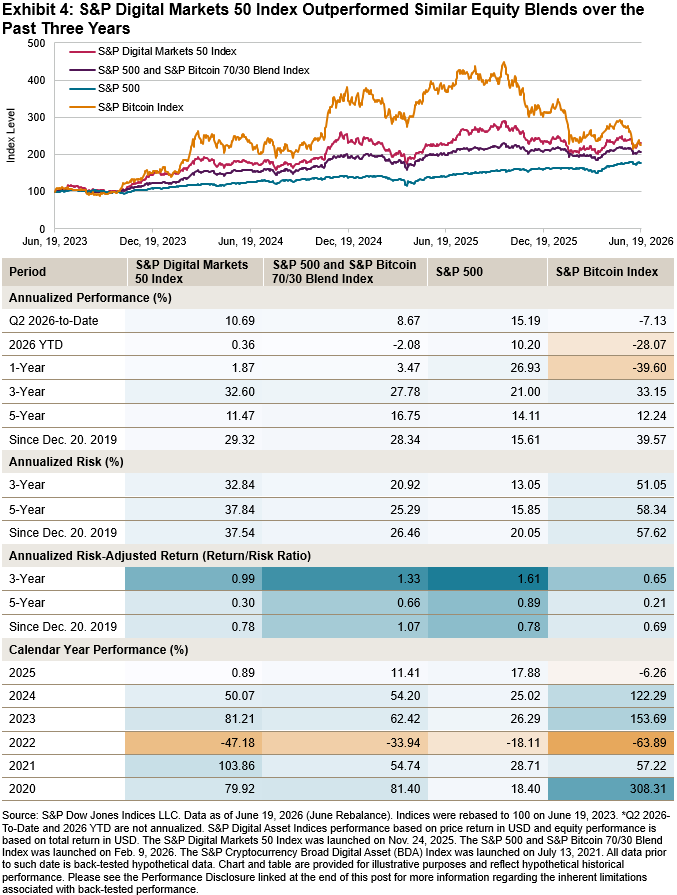
The S&P Digital Markets 50 Index provides market participants with a view of some of the upside capture of the crypto market and characteristics of the equity market, with a lower downside versus pure crypto assets. For example, in 2022, the S&P Digital Markets 50 Index declined 15% less than the standalone S&P Bitcoin Index, which saw a downside of 64%. In 2021, the S&P Digital Markets 50 Index outperformed both the S&P 500 and the S&P Bitcoin Index, demonstrating the potential tailwinds that can occur when both crypto-linked equities and the digital assets universe beyond crypto are outperforming.

When compared to a similar multi-asset index—the S&P 500 and S&P Bitcoin 70/30 Blend Index—the S&P Digital Markets 50 Index outperformed over various time periods, including 2026 YTD, the three-year horizon, and since the index’s first value date on Dec. 19, 2019.

For market participants with a strong interest in the future of digital assets and the crypto ecosystem, the S&P Digital Markets 50 Index could serve as a useful measure of this dual approach across equities and digital assets.

To learn more about the index, please see the S&P Digital Markets 50 Index brochure.

1 Please see the S&P Crypto Ecosystem Index Methodology for the full details, such as constraint relaxation, turnover mitigation rules and corporate action treatment.

The posts on this blog are opinions, not advice. Please read our Disclaimers.

Introducing the S&P/B3 VIX Futures Index: A New Benchmark for Brazilian Equity Market Volatility

Contributor Image
Anna Mittra

Associate Director, Global Exchanges

S&P Dow Jones Indices

As Brazil’s capital markets continue to mature, market participants now have access to a new tool for measuring and tracking volatility: the S&P/B3 VIX® Futures Index. Launched on May 25, 2026, this index represents a significant addition to the S&P/B3 Futures Indices and a meaningful step forward for the theme of volatility in Brazil.

What Is the S&P/B3 VIX Futures Index?

In December 2025, B3 launched VIX futures contracts on the S&P/B3 Ibovespa VIX—an implied volatility index that measures the market’s 30-day expectations for the volatility of the Ibovespa, Brazil’s headline equity benchmark. These contracts give market participants a direct and tradeable way to express a view on Brazilian equity volatility and to hedge equity market downturns.

The S&P/B3 VIX Futures Index is built based on these contracts and measures the performance of maintaining a constant 30-day long position in S&P/B3 Ibovespa VIX Futures. The index holds the next two near-term VIX futures contracts at any given time and rolls daily from the first- to second-month contracts in equal fractional amounts to maintain the constant one-month position.

Notably, the methodology is similar to the well-established S&P 500® VIX Short-Term Futures Index, which underlies some investable volatility products for U.S. markets.

Putting the Index to Work

The S&P/B3 VIX Futures Index serves an important function in the equity volatility ecosystem. Because VIX itself is a statistical metric that is not replicable, a rolling futures index could be used to support volatility ETFs, structured products and other financial products. However, it is important to understand that while the S&P/B3 VIX Futures Index tends to be highly correlated to the spot S&P/B3 Ibovespa VIX (see Exhibit 1), the two indices are unlikely to experience similar percentage returns—particularly over longer periods of time. This is the result of a couple major factors.

First, the spot S&P/B3 Ibovespa VIX measures real-time market expectations of Ibovespa volatility, whereas the S&P/B3 VIX Futures Index reflects the forward price of volatility one month out; hence, the S&P/B3 VIX Futures Index will typically experience smaller changes in magnitude compared to the spot VIX.

Second, VIX futures markets are typically in contango—front-month contracts tend to trade cheaper than next-month contracts. As the S&P/B3 VIX Futures Index rolls from the cheaper to the pricier contract, it experiences a negative roll yield that erodes value over time. This is why volatility products built on the index are typically held for short-term periods.

This dynamic is evident in the more established U.S. market (see Exhibit 2), where the S&P 500 VIX Short-Term Futures Index has steadily decayed toward zero since 2020, even as the spot VIX continues to oscillate within its historical range, highlighting how negative roll yield can erode the value over time.

A New Chapter for Brazilian Volatility Markets

The launch of the S&P/B3 VIX Futures Index marks an important milestone for Brazil’s derivatives market. The index follows the approach of the S&P 500 VIX Short-Term Futures Index, which underlies an ecosystem of tradable volatility products built on S&P 500 volatility. With Brazil entering an uncertain political phase ahead of upcoming elections and external headwinds such as U.S. tariffs, having reliable tools to measure and manage Brazilian market volatility could be essential. In a market defined by uncertainty, the S&P/B3 VIX Futures Index expands the risk management tools available to navigate volatile market cycles.

The posts on this blog are opinions, not advice. Please read our Disclaimers.

Is It Value? Is It Growth? The International Financials Sector Can Now Be Both

Contributor Image
Diego Zurita

Senior Analyst, Global Equities & Thematics

S&P Dow Jones Indices

The Financials sector has traditionally been categorized as value (i.e., stocks considered undervalued but with stable fundamentals) instead of growth (i.e., stocks with higher valuations but that are expected to grow faster than the market). Historical data supported this perception until recently (see Exhibit 1). By the end of May 2026, the weight gap for the Financials sector between the S&P Developed Ex-U.S. LargeMidCap Value and S&P Developed Ex‑U.S. LargeMidCap Growth narrowed to less than 1% (24.3% versus 23.4%, respectively), after being around 21% one year prior (35.1% versus 14.3%, respectively). This change shows a notable convergence between styles.

The recent performance of international equities played a key role in this convergence. Driven by diversification away from U.S. equities, international equities have seen renewed interest. After posting one of its strongest annual performances in 2025 (up 35.1%), the S&P Developed Ex-U.S. LargeMidCap’s outperformance persisted this year; by the end of May 2026, the index was up 16.1% YTD, while the S&P 500® was up 11.3% YTD (see Exhibit 2). Financials, the largest GICS® sector within the index by weight, has been the primary driver of this performance. It surged 52.0% in 2025 and was up 32.8% YTD by May 31, 2026.

To understand why this performance altered the sector’s style profile, it is helpful to revisit how S&P Dow Jones Indices determines the style of an individual stock. According to the S&P Global BMI Methodology, a growth score-to-value score ratio is calculated for each stock. The style scores are calculated using standardized fundamental data of the company, as noted in a previous blog. Depending on the score, the float-adjusted market cap of a stock is assigned completely to the growth or value version of the index or is distributed proportionally based on its relative distance to the average value and growth scores. Exhibit 3 illustrates this classification.

With that framework in mind, the style reclassification is explained by two main factors. First, three of the four value factors (book-to-price, cash-flow-to-price and sales-to-price) are directly affected by share price movements. Since price appears in the denominator of these ratios, sharp price appreciation weakens the value score, assuming that balance sheet fundamentals do not rise at the same pace.

On the other hand, the growth score focuses on the growth of earnings and sales. In recent years, European banks have seen an improvement in profitability, while major Japanese banks reached record profit levels in 2025 for a second consecutive year.

Together, these developments have created a style reclassification effect. On one hand, valuation‑based value signals weakened as bank share prices surged. On the other hand, rising earnings and improving performance profiles strengthened growth factors.

This shift was clearly visible during the September 2025 rebalance. Compared to the prior year, the weight of Financials in the S&P Developed Ex‑U.S. LargeMidCap Growth increased from 12.5% to 24.0%, while its weight in the S&P Developed Ex-U.S. LargeMidCap Value declined from 32.3% to 26.1%. During this period, 19 stocks transitioned from being categorized as blended to growth, and 11 companies switched from value to growth, adding approximately USD 2.1 trillion in market capitalization to the S&P Developed Ex‑U.S. LargeMidCap Growth (see Exhibit 4).

Large banks have not only driven index performance; they have also contributed to the migration across styles. BBVA, Royal Bank of Canada, UniCredit and Mitsubishi UFJ, which were part of the S&P Developed Ex-U.S. LargeMidCap Value before the September 2025 rebalance, represented 4.9% of the S&P Developed Ex‑U.S. LargeMidCap Growth’s total weight in May 2026.

In brief, the strong performance of international Financials in recent years, driven by both rising share prices and improved fundamentals, has altered the long-standing perception of the sector as exclusively value oriented. Internationally, Financials has become more balanced in terms of style, converging between growth and value weights.

The posts on this blog are opinions, not advice. Please read our Disclaimers.

Navigating Fixed Income in a Changing Market: S&P/ASX iBoxx Australian & State Governments 0+ Index

How is innovative index construction supporting investment decisions in a shifting interest rate environment? S&P DJI’s Jessica Tan sits down with industry experts to share insights on how market participants can better navigate uncertainty and uncover new opportunities in fixed income through index-based strategies.

The posts on this blog are opinions, not advice. Please read our Disclaimers.

Exploring Growth at a Reasonable Price: S&P/ASX 200 GARP Index

What innovative strategies are market participants increasingly exploring to measure growth? S&P DJI’s Jason Ye sits down with Andrew Geoghegan from ausbiz to discuss how GARP, or growth at a reasonable price, is an approach that is gaining traction in the Australian market.


The posts on this blog are opinions, not advice. Please read our Disclaimers.