
Get Indexology® Blog updates via email.

In This List

A New Take on Commodities: Inside the Dow Jones Commodity Index 3 Month Forward – Quarterly Reweight

SPIVA By the Numbers: A Global Perspective

The Rebalance | The Future of Indexing On-Chain with Kaiko

The Race for Critical Materials and the Shift to Security

The Taiwan Paradox: Balancing Concentration Risk with Global Diversification

A New Take on Commodities: Inside the Dow Jones Commodity Index 3 Month Forward – Quarterly Reweight

Contributor Image
Rebecca Kaufman

Associate Director, Commodities and Fixed Income Tradables

S&P Dow Jones Indices

In this blog, we introduce the Dow Jones Commodity Index 3 Month Forward – Quarterly Reweight (DJCI 3MQT). Launched in August 2025, the DJCI 3MQT is a variant of the Dow Jones Commodity Index (DJCI). The DJCI 3MQT has historically outperformed the S&P GSCI and the Bloomberg Commodity Index (BCOM): over the 10-year period ending June 30, 2026, the DJCI 3MQT outperformed the S&P GSCI by 175 bps and the BCOM by 330 bps.

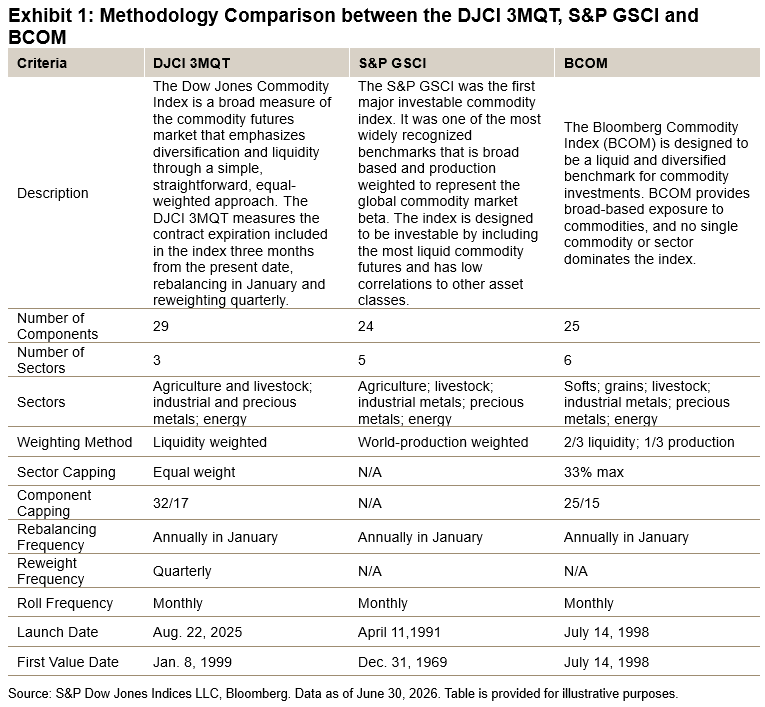
As of its January 2026 reconstitution, the DJCI 3MQT includes 29 commodity futures contracts, representing global commodities across three sectors: agriculture and livestock; energy; and metals. Like the S&P GSCI and BCOM, the DJCI 3MQT holds the front-month futures contract, rolls monthly and rebalances annually in January.

Unlike the S&P GSCI and BCOM, the DJCI 3MQT is liquidity weighted and reweights quarterly. Additionally, the DJCI 3MQT caps the maximum weight of any commodity component at 32%, with any remaining commodity components capped at 17%, and equally weights between commodity sectors. These weighting constraints are applied iteratively until all requirements are met.

Exhibit 1 shows a methodology comparison between the DJCI 3MQT, S&P GSCI and BCOM.1
Let’s explore how the DJCI 3MQT’s three unique methodology components—emphasis on liquidity, equal weighting between sectors and quarterly rebalancing—have historically enhanced performance and reduced volatility.

Emphasis on Liquidity

By emphasizing liquidity, the DJCI 3MQT offers a unique measurement of the commodities market. Liquidity, which is proxied by the total dollar value traded for constituent commodities, determines the weight and, therefore, the importance of the constituents within the index.

As commodities are real assets, it’s difficult for commodity producers to quickly change production or storage capacity to meet changes in demand. In contrast, financial market participants, such as hedgers and speculators, can quickly change their trading behavior to meet changes in demand. As such, the liquidity of commodities contracts, rather than their production data, more accurately mirrors the real-time importance of individual commodities.

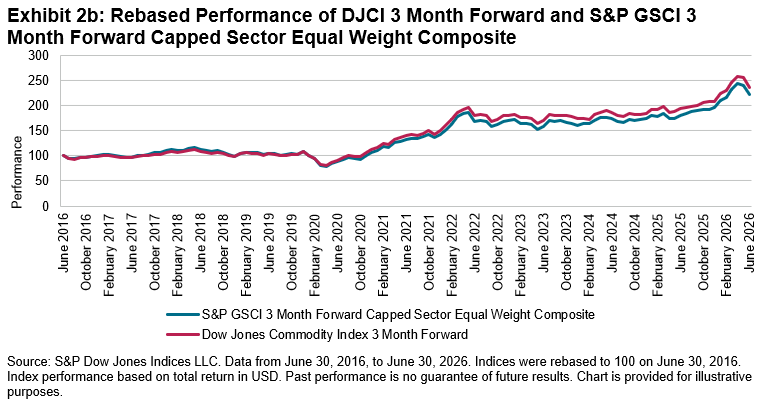
The historical effect of liquidity on index performance is clear. In Exhibit 2, we compare the Dow Jones Commodity Index 3 Month Forward (DJCI 3M) against the S&P GSCI 3 Month Forward Capped Sector Equal Weight Composite.2 These two indices are methodologically the same, other than the choice between liquidity or production. As of June 2026, the DJCI 3M had outperformed the S&P GSCI 3 Month Capped Sector Equal Weight Composite by 69 bps on a 10-year basis.

Equal Weighting between Sectors

Next, we turn to the second characteristic of the DJCI 3MQT—enhanced diversification. Compared to the S&P GSCI and BCOM, the DJCI 3MQT has historically had higher diversification through its overall constituent count (29 versus 24 and 25, respectively),3 as well as through its unique equal-weighted approach to commodity sectors and concentration limits on individual commodities.

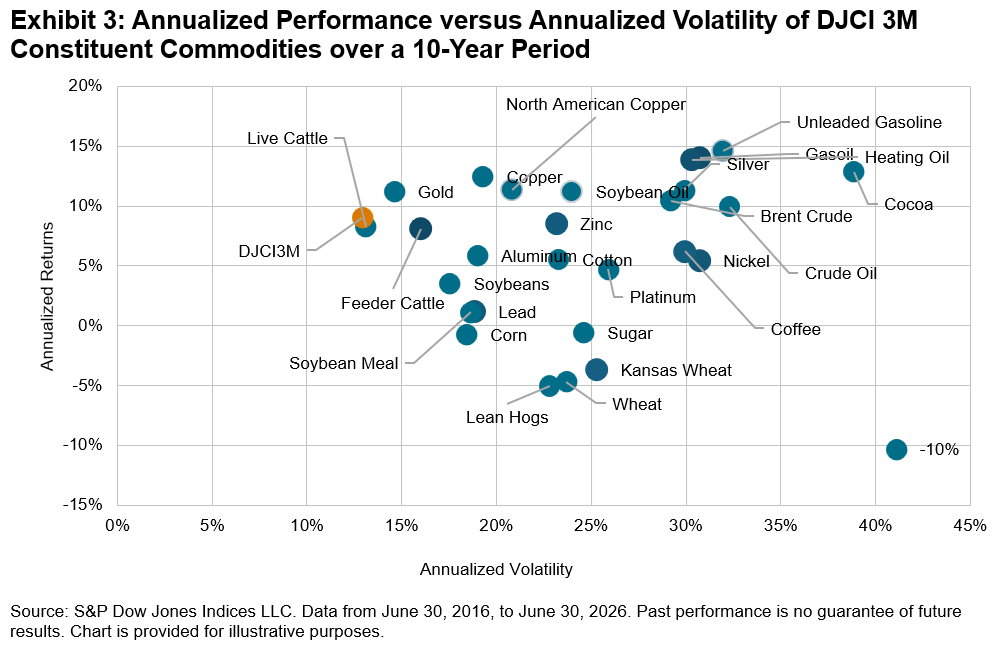
The effect of being highly diversified is demonstrated in Exhibit 3, which graphs the annualized performance against the annualized volatility of the DJCI 3M and its constituent commodities over the past 10 years.4 The DJCI 3M achieved higher annualized performance while exhibiting lower annualized volatility compared to its constituent commodities.

As of June 2026, the 10-year weighted average annualized performance of the DJCI 3M constituent commodities was 7.1%, and the 10-year annualized performance of the DJCI 3M was 9.0%. The 10-year weighted average annualized volatility of DJCI 3M constituent commodities was 23.9%, and the 10-year annualized volatility of the DJCI 3M was 12.9%. This demonstrates the essence of modern portfolio theory—that diversification may be the only “free lunch” in investing—as the DJCI 3M has both increased annualized performance and decreased annualized volatility compared to its individual constituents.
More Frequent Reweighting

Finally, we turn to the third characteristic of the DJCI 3MQT’s methodology: more frequent reweighting. The DJCI 3MQT reweights quarterly to its annual January rebalance weights. This reweighting enables the index to adhere to its intended, liquidity-based weights.

Without the quarterly reweight, the effective U.S. dollar weights of the constituent commodities float based on price changes; this unintentionally adds a momentum component to the index. However, commodities are often mean reverting, such that a momentum strategy can underperform.

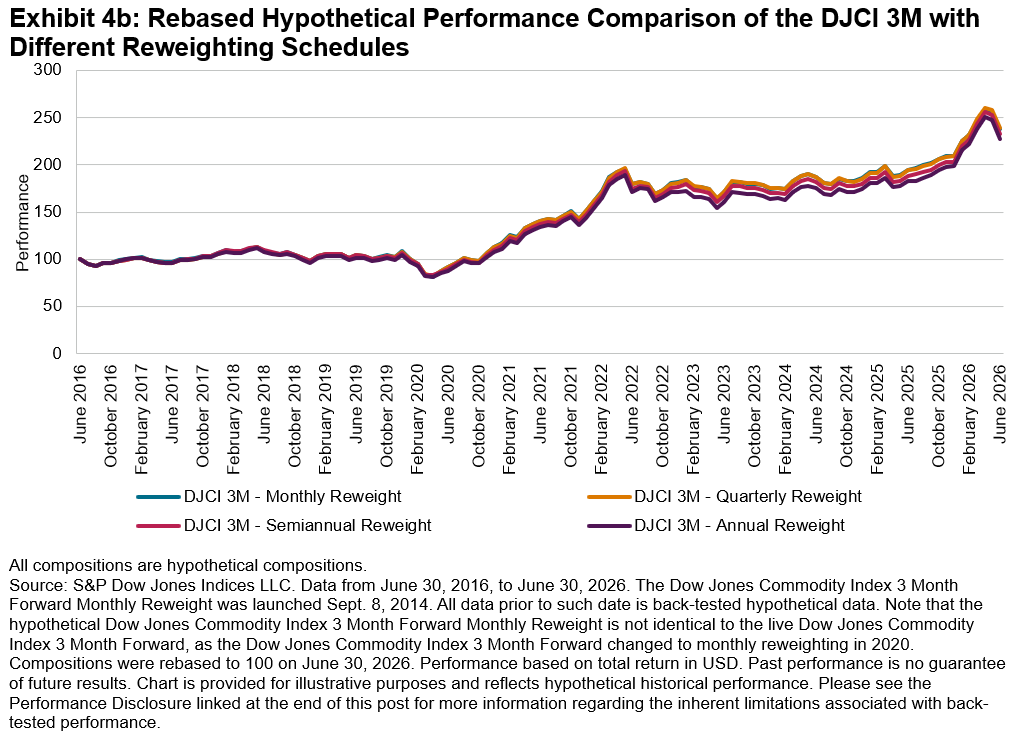
A potential positive effect of a more-frequent reweighting strategy is shown as a comparison in Exhibit 4, which outlines the performance of hypothetical compositions of the DJCI 3M with different reweighting schedules: monthly, quarterly, semiannually and annually. As of June 2026, the quarterly reweight version of the DJCI 3M outperformed the annual reweight (i.e., no reweight) version by 55 bps over the 10-year period.

For further reading, please see Why DJCI? and Dow Jones Commodity Index 3 Month Forward: A Simple Strategy to Measure Enhanced Roll Yield.


1 For more information, please see the Dow Jones Commodity Index Methodology.

2 There is no exact S&P GSCI corollary for the DJCI 3MQT, therefore the DJCI 3M is used as a proxy to isolate the impacts of liquidity weighting.

3 As of the indices’ respective January 2026 reconstitution

4 DJCI 3MQT single constituent commodities are not readily available. Therefore, the analysis in this exhibit is proxied with the DJCI 3M.

The posts on this blog are opinions, not advice. Please read our Disclaimers.

SPIVA By the Numbers: A Global Perspective

How difficult is it to beat the benchmark in markets around the world? S&P DJI’s Tim Edwards takes viewers inside the latest SPIVA results and explores the challenges of active management over the long term. 

The posts on this blog are opinions, not advice. Please read our Disclaimers.
The Rebalance | The Future of Indexing On-Chain with Kaiko

The Rebalance is a video podcast series hosted by S&P DJI CEO Cathy Clay, exploring the trends, ideas and innovations shaping the future of capital markets. In this installment, Cathy sits down with Kaiko CEO Ambre Soubiran to discuss S&P DJI’s collaboration with Kaiko to tokenize the iBoxx USD Treasuries Index and bring a major financial benchmark on-chain as a native digital asset. Learn how trusted benchmarks, digital asset infrastructure and institutional standards are coming together to support the next generation of capital markets.

The posts on this blog are opinions, not advice. Please read our Disclaimers.
The Race for Critical Materials and the Shift to Security

Contributor Image
Sabatino Longo

Analyst, Global Equity & Thematic Indices

S&P Dow Jones Indices

From Efficiency to Security

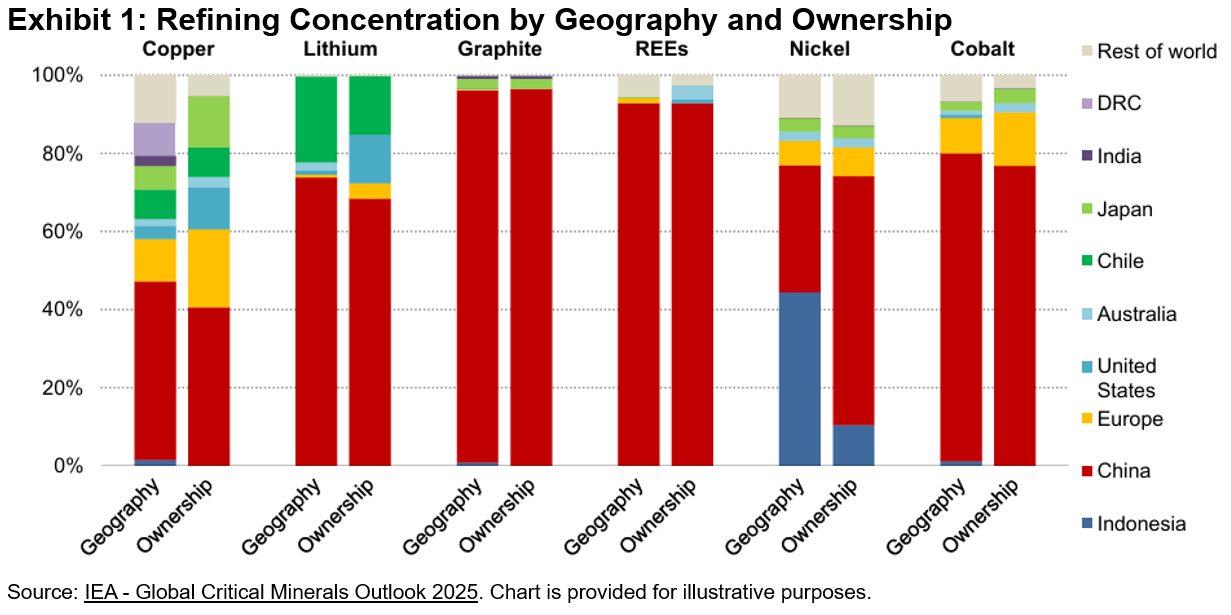
Over the past few months, two themes have dominated market attention, artificial intelligence (AI) and energy supply. Each is driven by different forces, yet both are increasingly pushing governments in a similar direction—toward supply security and reduced external dependence.

Recent developments help illustrate this shift. Reports of Anthropic restricting access to its latest AI models have raised concerns in Europe about reliance on external providers for critical AI technologies.1 At the same time, ongoing tensions around the Strait of Hormuz have highlighted the fragility of global oil and commodity supply routes.2 Earlier disruptions, particularly the world’s heavy dependence on China for rare earth elements (REEs), had already exposed similar vulnerabilities3 and prompted policy responses such as the EU Critical Raw Materials Act.4

These developments point to a meaningful shift. Access to key inputs is no longer guaranteed, and policy is moving from just-in-time efficiency toward just-in-case resilience.

Infrastructure Driving Critical Minerals Demand

One area where this shift is becoming visible is in demand for critical minerals.5 The buildout of digital infrastructure is driving demand, while concerns around supply concentration and security are bringing the supply side into sharper focus.

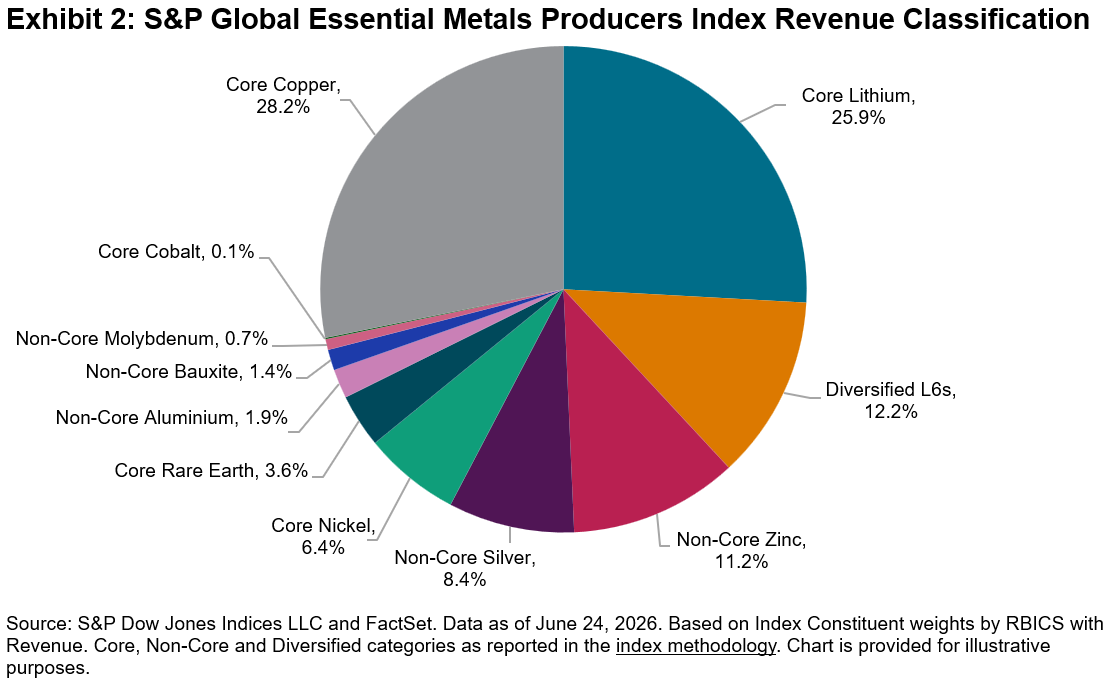
The S&P Global Essential Metals Producers Index, launched in August 2023, tracks companies involved in the extraction or ownership of reserves of essential metals, a subset of the broader critical minerals universe. These metals are central to two major transformations over the next decade: the expansion of AI and digital infrastructure, and the acceleration of the energy expansion.

The index goes beyond current production by incorporating both company revenues and estimates of underlying reserves, helping reflect future alongside present supply.Strong Performance Driven by Key Sub-Industries

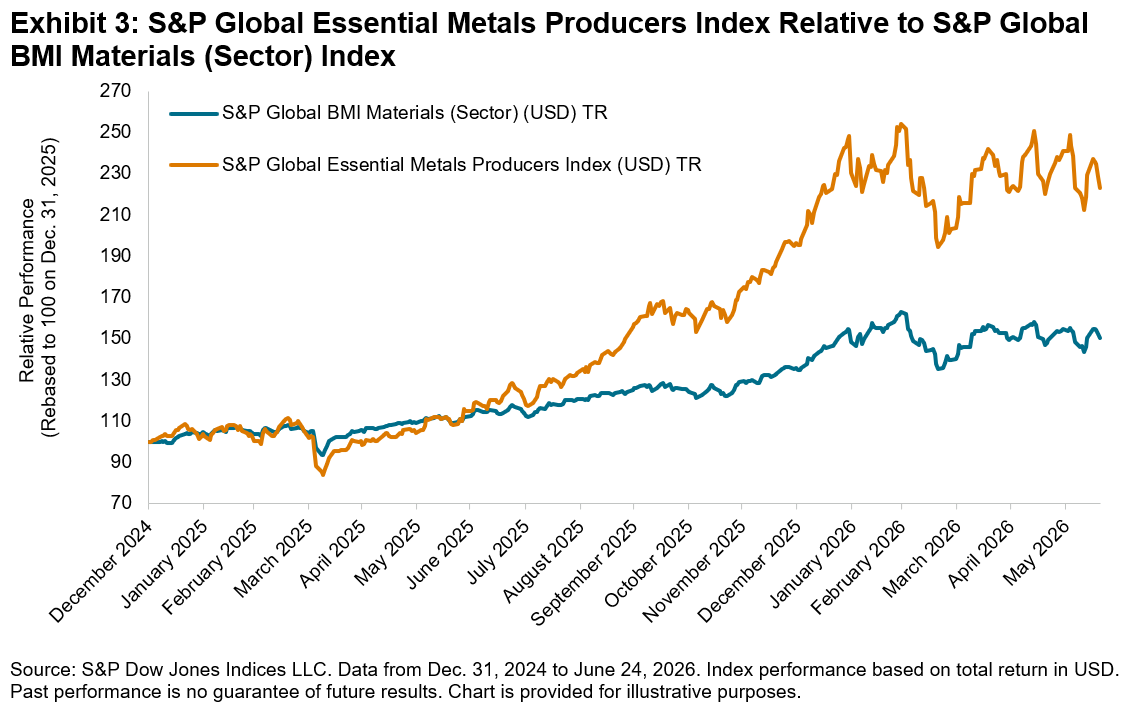
Following its launch in August 2023, the S&P Global Essential Metals Producers Index underperformed its starting level for an extended period, reflecting limited early attention to the theme. This changed in August 2025, when the index broke out of its range and rallied sharply. It nearly doubled by February 2026, outperforming the S&P Global BMI Materials (Sector) by 71%.

This performance was largely driven by companies within the Diversified Metals & Mining, Precious Metals & Minerals, Silver and Copper GICS® sub-industries. At the constituent level, Southern Copper Corporation and Boliden were the primary contributors.

More recently, geopolitical developments have tempered this momentum. The onset of the Iran conflict led to a period of consolidation, with the index moving within a narrower range since early March 2026. The index was up approximately 2% QTD as of June 24, 2026, broadly in line with the global materials benchmark. What stands out is the change in performance drivers. Earlier gains were broad-based, led by strong contributions from multiple GICS sub-industry groups. In contrast, recent performance has become far more concentrated, with only modest positive contributions from Diversified Metals & Mining (2%) and Copper (1%), while several previously supportive segments have turned into slight drags.

Structural Demand Meets Supply Constraints

The AI buildout is already underway, driving investment in data centers, power infrastructure and networks, and creating immediate demand for critical materials. This demand is structural, as it is tied to long-term infrastructure rather than economic cycles. Policy is reinforcing this, with governments prioritizing supply security and reducing reliance on concentrated supply chains.

At the same time, supply remains slow to respond, as new mining capacity can take years to develop. This combination of structural demand, supportive policy and constrained supply underpins a more durable outlook for the sector.6

The S&P Global Essential Metals Producers Index provides a barometer to track demand for critical materials and the evolving supply landscape. Its focus on companies involved in both demand growth and resource ownership helps illustrate how this segment evolves over time. Importantly, it reflects demand that is structural and tied to infrastructure buildout, rather than technology adoption cycles.


1EU Commission looking at practical consequences of Anthropic decision, spokesperson says,” Reuters, June 14, 2026.

2 Bazilian, Morgan and Jamie Webster, “How China Turned the Strait of Hormuz Crisis into an Advantage,” The National Interest, June 23, 2026.

3 Baskaran, Gracelin and Meredith Schwartz, “Rare Earth Export Restrictions One Year Later,” CSIS, April 27, 2026.

4 Critical Raw Materials Act – European Commission

5 What Are Critical Minerals and Materials? – U.S. Department of Energy

6Critical minerals outlook: surging demand, expanding supply chains,” JPMorgan Chase, Feb. 23, 2026.


The posts on this blog are opinions, not advice. Please read our Disclaimers.
The Taiwan Paradox: Balancing Concentration Risk with Global Diversification

Contributor Image
Marco Zhang

Quantitative Analyst, Index Investment Strategy

S&P Dow Jones Indices

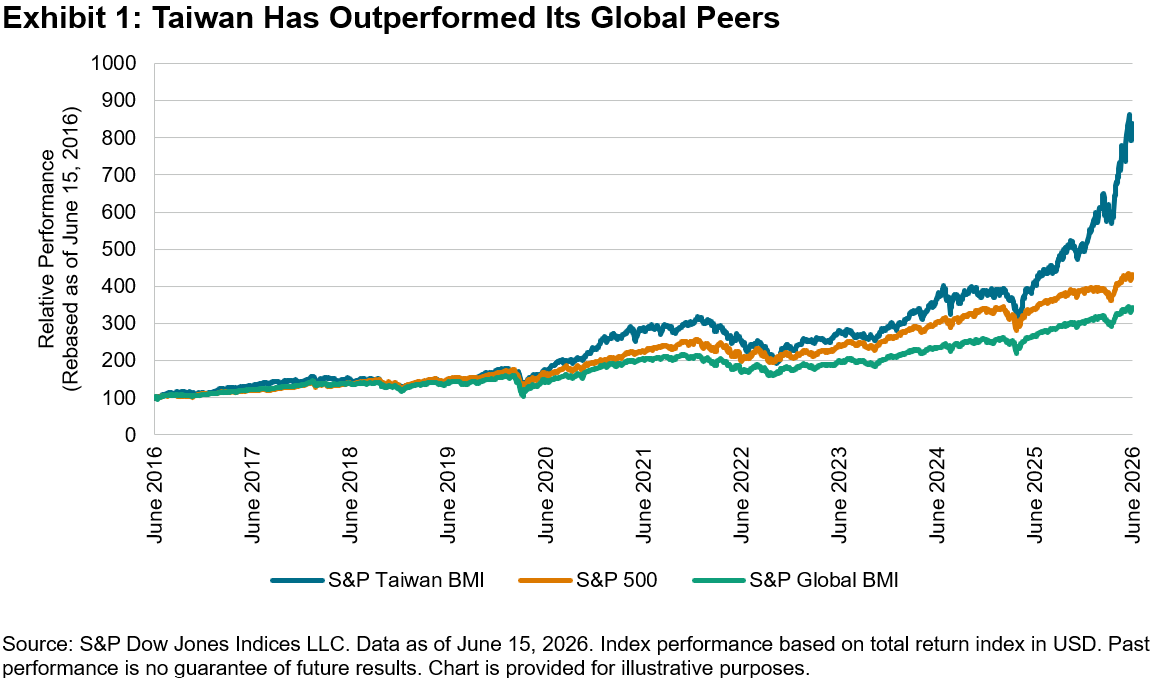
Few economies are as deeply embedded in the global technology supply chain as Taiwan. Its highly sophisticated chip manufacturing network benefits from demand across a broad range of high-value end markets, from AI infrastructure and data centers to smartphones and electric vehicles. This positioning has propelled the S&P Taiwan BMI to an average annualized gain of 23.4% in Taiwanese dollar terms (23.7% in U.S. dollar terms) over the past 10 years, significantly outperforming global equities, as measured by the S&P Global BMI, and U.S. equities, as measured by the S&P 500®.

When markets are rising, strong performance can grab the headlines and risks can often be overlooked. One of the primary risks in Taiwanese equities is concentration. The market’s reliance on the semiconductor industry is evidenced by the fact that the Taiwan Semiconductor Manufacturing Company (TSMC) alone represented a 44% weight in S&P Taiwan BMI, as of June 15, 2026. As illustrated in Exhibit 2, at the GICS® industry level, Semiconductors & Semiconductor Equipment accounted for roughly two-thirds of the S&P Taiwan BMI’s gains in 2025 and 2026 YTD.

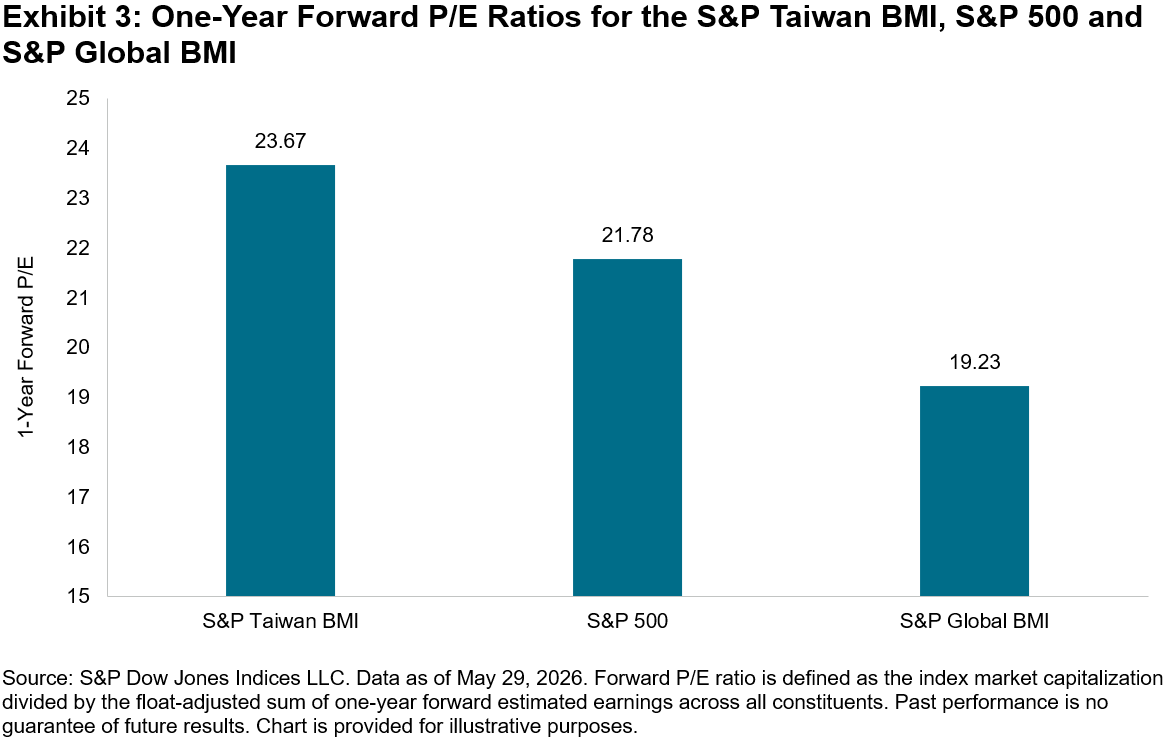
Valuation has also risen to a more stretched level. As of May 29, 2026, the one-year forward price/earnings (P/E) ratio of the S&P Taiwan BMI had risen to 23.67, at premiums of 9% and 23% to the S&P 500 and S&P Global BMI, respectively. While valuations are not indicators of market direction, high valuations may provide context for assessing sensitivity to changes in market sentiment.

Given the concentration risk and elevated valuation of Taiwanese equities, global diversification may be a relevant consideration when evaluating Taiwan-based strategies. For a Taiwan-based equity strategy, a globally diversified index offers three things:

  • Diversified sector profile that balances technology and other sectors;
  • Diversified regional profile; and
  • Reduced valuation.

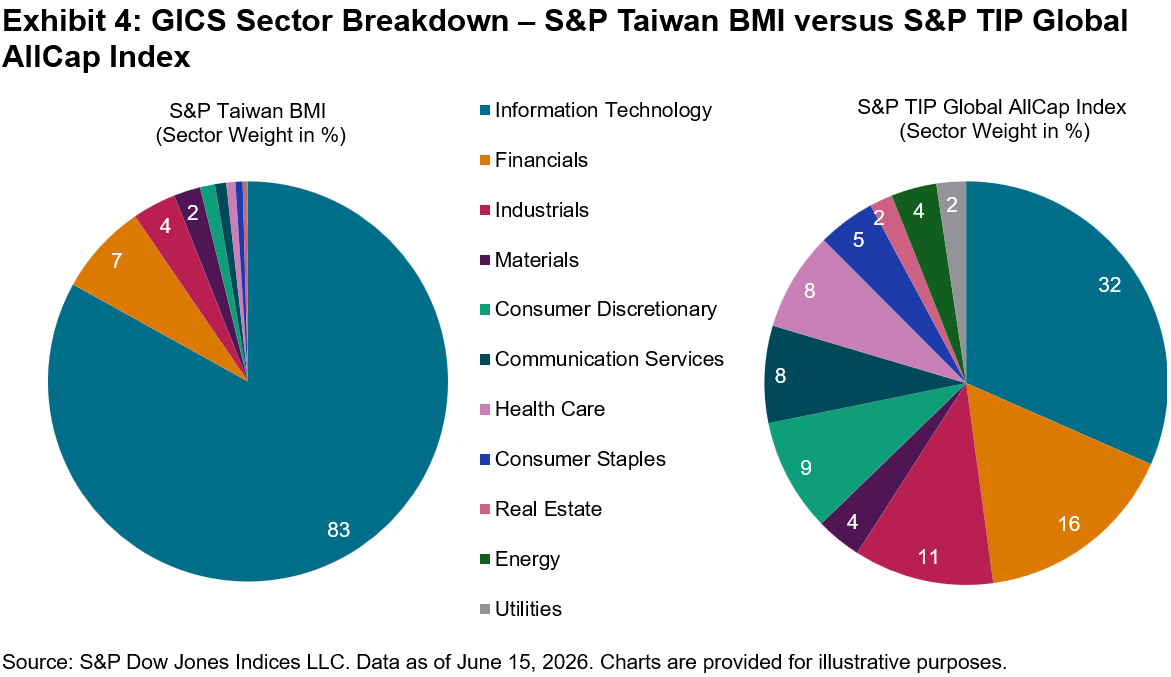
The S&P TIP Global AllCap Index targets 90% of the float-adjusted market capitalization of the S&P Global BMI and represents a broader global equity universe than a Taiwan-focused strategy.1 The index included 2,272 constituents across 48 markets as of June 15, 2026. Exhibit 4 highlights a more balanced sector profile of the S&P TIP Global AllCap Index compared with the S&P Taiwan BMI’s 83% weight in Information Technology. Lastly, the S&P TIP Global AllCap Index has traded at a more moderate valuation, with a one-year forward P/E ratio of 18.96, compared with 23.67 for the S&P Taiwan BMI as of May 29, 2026.

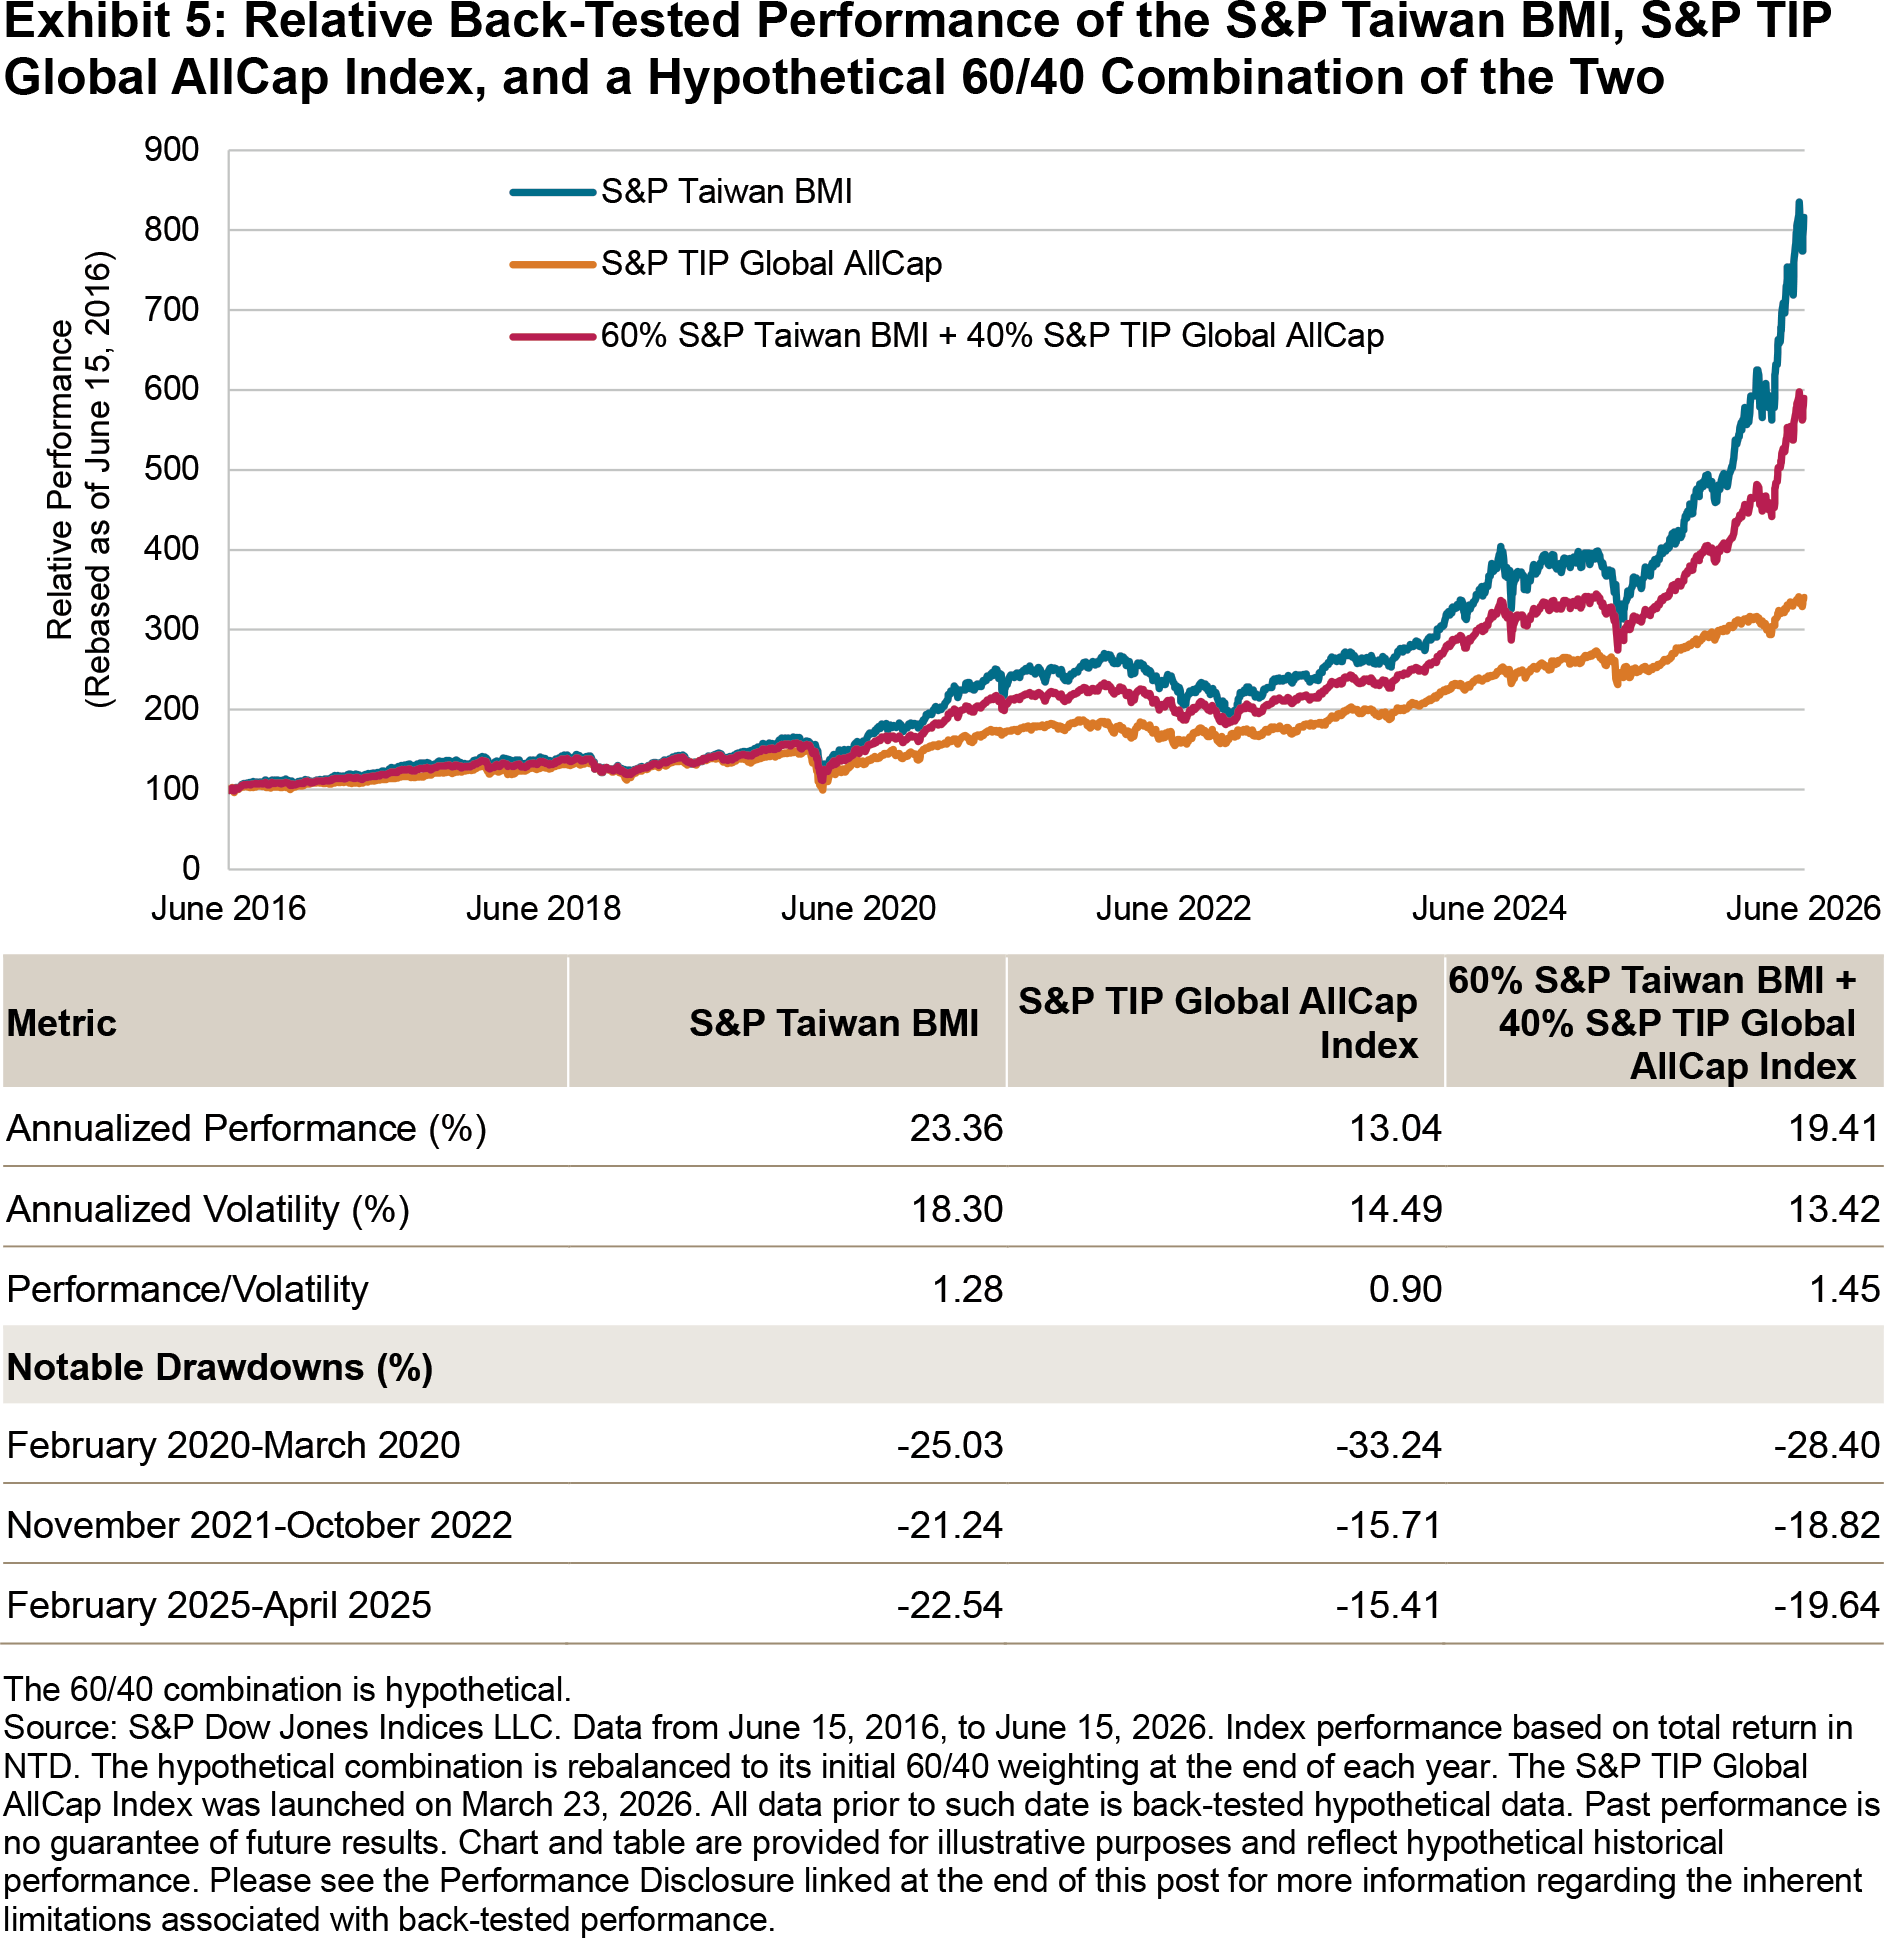
Over the past decade, the S&P Taiwan BMI has outperformed the S&P TIP Global AllCap Index on both an absolute and risk-adjusted basis. However, diversification coincided with an improved balance between performance and risk. For example, a hypothetical blend of 60% S&P Taiwan BMI and 40% S&P TIP Global AllCap Index would have delivered stronger risk-adjusted performance than either individual index over the period studied (see Exhibit 5). This hypothetical back-tested analysis shows the historical effects of combining a Taiwan equity-focused index with a more globally diversified index: lower volatility while preserving much of the performance. The hypothetical 60/40 blend’s smaller pullbacks during recent market downturns in 2021-2022 and 2025 further highlight the diversification effects.

To learn more, check out our recent piece, “TalkingPoints: Measuring Global Equity Beta with the S&P TIP Global AllCap Index.”

1 The index is owned by S&P Dow Jones Indices, with the Taiwan Index Plus Corporation (TIP) serving as the local partner in the Taiwanese market. See the S&P TIP Global All Cap Index Methodology for more details on the index construction.

This content may be AI-assisted and is composed, reviewed, edited, and approved by S&P Global.

The posts on this blog are opinions, not advice. Please read our Disclaimers.