
Get Indexology® Blog updates via email.

In This List

Parsing Productive Assets with the S&P Pantera Digital Asset Index

35/20 Vision: The S&P 500 Capped 35/20 Indices

2026 YTD Commodities Surge amid Renewed Inflation

S&P 500: America's Benchmark

The Case for the S&P Dividend Aristocrats in Today’s Market

Parsing Productive Assets with the S&P Pantera Digital Asset Index

Contributor Image
Sherifa Issifu

Associate Director, Global Exchanges

S&P Dow Jones Indices

Moving beyond Narrative: A Fundamental Lens on Digital Assets

Digital asset markets have evolved rapidly, but the tools used to evaluate them have not kept pace. Many crypto strategies have historically been shaped by market narratives, momentum or broad exposure to the largest tokens.1 Designed with the crypto and blockchain investment firm Pantera Capital and powered by Artemis Analytics data, the S&P Pantera Digital Asset Index takes a different approach: it measures the market performance of a subset of digital assets that demonstrate observable and recurring economic activity through protocol-level revenue generation.

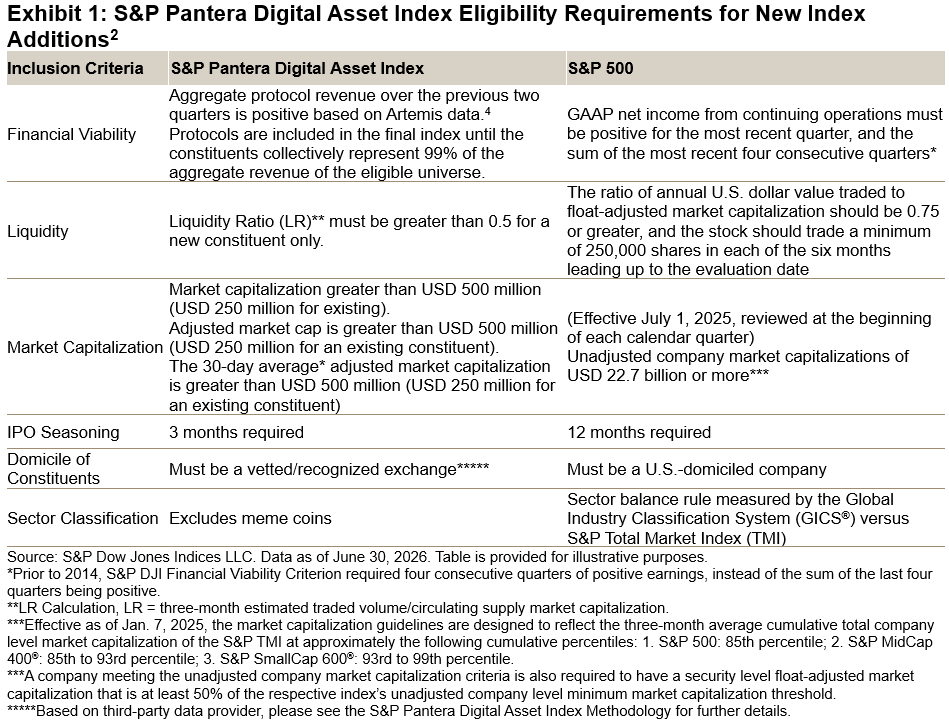
In traditional equity markets, investors often look for evidence of fundamental strength through measures such as revenues, earnings, margins or cash flows. Digital assets do not map as neatly onto that framework, but some protocols do generate measurable economic activity through mechanisms such as transaction fees, token burns or other protocol-level revenue streams. The S&P Pantera Digital Asset Index uses this activity as an indicator of financial viability, mirroring the higher entry threshold of the S&P 500® compared to other U.S. equity indices2 alongside standard index construction toolkits related to investability criteria and diversification.

Constructing the S&P Pantera Digital Asset Index

The starting universe, the S&P Cryptocurrency Broad Digital Asset (BDA) Index, applies a base level of filters to remove smaller assets. One unique feature of digital assets is that the barrier to creating a tradable token is extremely low. Unlike public equities, where exchange listings come with baseline disclosure requirements and business standards, crypto offers no equivalent universal filter. The S&P Pantera Digital Asset Index has a seasoning rule of three months and constituents must be listed on a vetted exchange, recognizing that some newly launched crypto projects may achieve high market capitalization and liquidity in the very short run post-initial coin offering (ICO). Please see the S&P Pantera Digital Asset Index Methodology for more details.
Composition and Constituents of the S&P Pantera Digital Asset Index

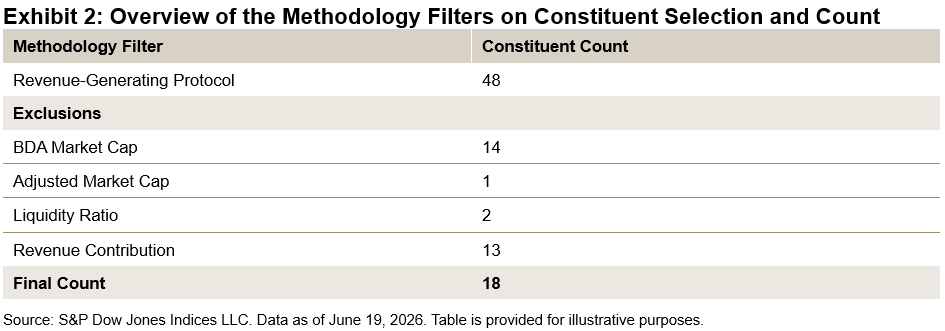
Here we look at the impact of the index filters on the final composition. The index doesn’t apply a fixed count, allowing constituents that meet the thresholds to be added over time. The current constituent count as of the June 2026 rebalance was 18, with a minimum constituent count of 5. While the early history had few protocols, over the last two years, the constituent count has been consistently above 10, perhaps indicating the increased maturity of the type of protocols available to market participants. While the number of protocols in our initial revenue pool was 48, around 15 were dropped based on the underlying benchmark and adjusted market cap, 2 failed to meet the liquidity threshold and 13 were excluded as their revenue falls within the bottom 1% of eligible constituents.
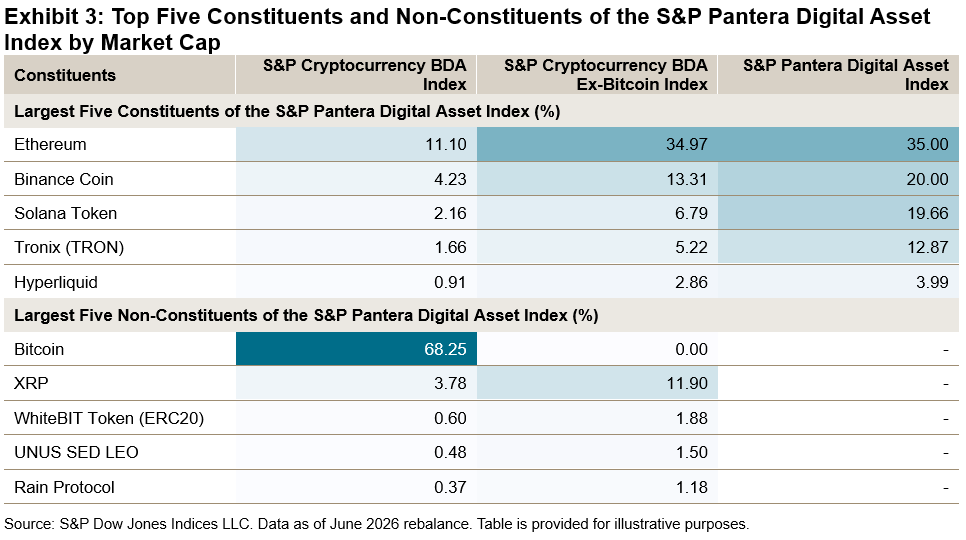
The revenue filter on the index means that, in practice, the type of protocols we typically see in the final selection are often smart contract platforms like Ethereum and Solana and decentralized finance applications like Hyperliquid. The largest five constituents are Ethereum, Binance Coin, Solana, TRON and Hyperliquid. The largest non-constituents when compared to the S&P Cryptocurrency BDA Index are Bitcoin and XRP, which are significant weights in standard market-cap-weighted indices.
Performance Characteristics of the S&P Pantera Digital Asset Index

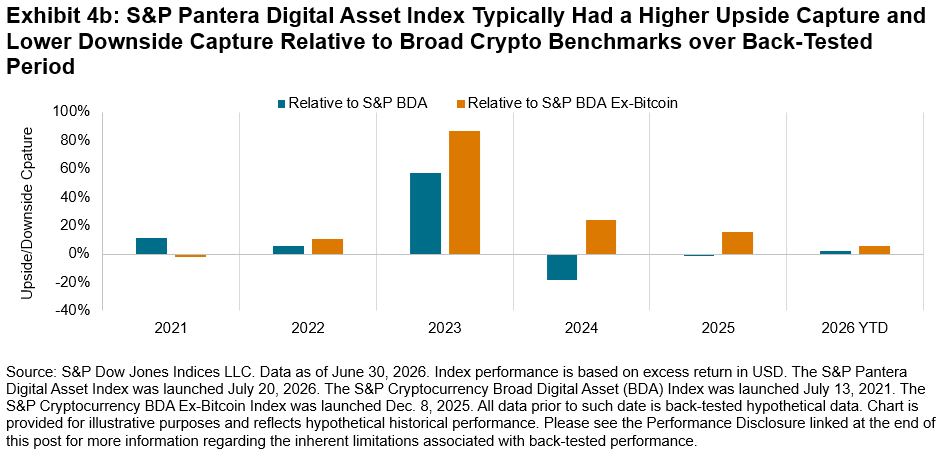
Despite not having Bitcoin in the index, based on back-tested analysis, the S&P Pantera Digital Asset Index has outperformed indices like the S&P Cryptocurrency BDA Index where Bitcoin accounts for approximately 70% of the index weight. Notably, over the three-year back-tested period ending June 30, 2026, the S&P Pantera Digital Asset Index had an annualized return of 25% versus 14% for the S&P Cryptocurrency BDA Index, an excess return of more than 10 percentage points, with a similar picture across the five-year period and since its first value date of June 18, 2021 (see Exhibit 4a and Exhibit 4b).

Conclusion

The S&P Pantera Digital Asset Index may serve a dual purpose: as a benchmark for actively managed crypto strategies and as a foundation for index-linked products. For different types of market participants, the S&P Pantera Digital Asset Index reflects the continued maturation of crypto benchmarking. By anchoring selection to observable protocol-level revenue, it offers a disciplined framework for evaluating digital assets through fundamentals. In a market often driven by narrative trading, the index’s emphasis on measurable activity offers a more data-driven way to understand where economic value may be forming in the digital asset ecosystem.

Learn more about the S&P Pantera Digital Asset Index in our brochure.


1 Watkins, Ryan, “The Productive Cryptoeconomy: A Thesis for Adoption,” Syncracy, Feb. 25, 2025.

2 S&P Dow Jones Indices and Pantera Capital Launch New Index for Digital Assets – Index Launches | S&P Dow Jones Indices

3 Preston, Hamish, “Seasoning to Taste,” S&P Dow Jones Indices, March 3, 2026.

4 Weseley, Alex, “Crypto Revenue,” Artemis, Sept. 12, 2025.

The posts on this blog are opinions, not advice. Please read our Disclaimers.

35/20 Vision: The S&P 500 Capped 35/20 Indices

Contributor Image
Florence Chapman

Senior Analyst, U.S. Equities

S&P Dow Jones Indices

As U.S. equity markets continue to reach new highs, market leadership has become increasingly concentrated among a handful of large-cap stocks. The S&P 500 Capped 35/20 Indices use weight caps to maintain diversification within sector-specific benchmarks. Each index in the range comprises all constituents from its respective GICS® sector of the S&P 500® while mitigating single-stock dominance. Capped indices such as these have emerged to meet the need for benchmarks that may facilitate diversification rules, rather than as an endorsement of any single approach to managing concentration.

The 35/20 Capping Mechanism

The S&P 500 Capped 35/20 Indices implement a multi-tier capping framework1 to control concentration risk. The capping thresholds are designed to facilitate the ability of regulated investment companies to meet certain diversification requirements under Directive 2009/65/EC (the “UCITS Directive”)2 of the European Parliament. The UCITS Directive imposes obligations on such investment companies, not on the index or its providers, and replication of the index does not guarantee compliance with the UCITS Directive at any given time.

At quarterly rebalancing (effective after the close of the third Friday of March, June, September and December), constituents are weighted according to float-adjusted market capitalization (FMC), with the largest and second-largest companies capped at 31.5% and 18% of the total index weight, respectively. Reference prices for the rebalance are taken from the Wednesday prior to the second Friday of the quarterly rebalance month.

In addition, two further capping checks occur in all months of the year:

  • Mid-Month: Checks are performed on the Wednesday prior to the third Friday using reference weights from that date. If the 35%/20% caps are breached, reweighting is effective after the close of the third Friday.
  • End-of-Month: Checks are performed on the third-to-last business day of the month. If the 35%/20% caps are breached, reweighting is effective after the close of the last business day.

In all capping scenarios, excess weight is proportionally redistributed to uncapped companies through an iterative process.

Constituent weights may fluctuate between reference and rebalance dates due to market movements and may exceed the capping threshold during such periods.

The Impact of Capping across Sectors

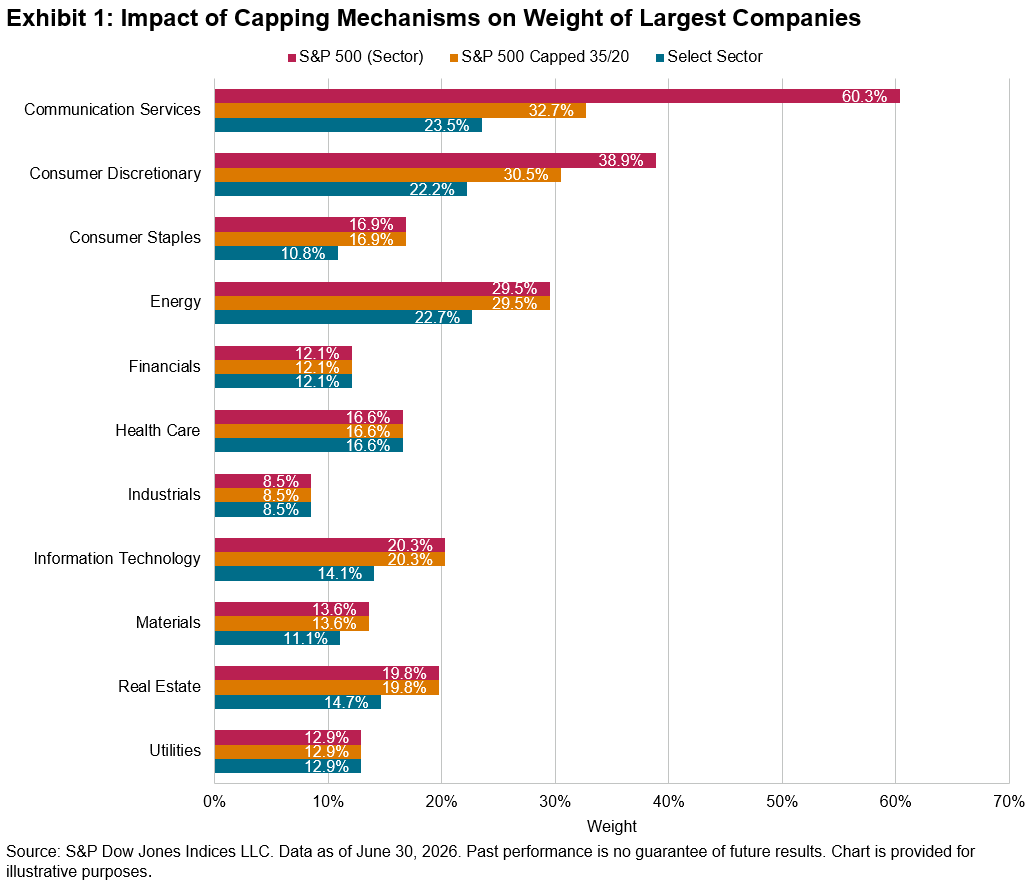
Exhibit 1 shows the impact of different capping mechanisms on the weights of the largest companies within the S&P 500 Capped 35/20 Indices against their uncapped S&P 500 Sector counterparts and the Select Sector® range (which apply a different, 25/5/50 capping rule).3

For broadly diversified sectors such as Industrials and Financials, the weights of the largest companies have naturally fallen below capping thresholds over the last 10 years. Consequently, the 35/20 indices mirror their capped and uncapped counterparts in constituent weighting and historical performance over the period.

On the other hand, sectors dominated by mega-cap names show the biggest variations in weight under the different capping methodologies. For example, Alphabet’s substantial 60.3% uncapped weight in Communication Services falls to 32.7% under the 35/20 methodology, and 23.5% under the Select Sectors’ 25/5/50 rules. Similarly, in Consumer Discretionary, Amazon’s 38.9% uncapped weight is reduced to 30.5% and 22.2% in the S&P Capped 35/20 and Select Sector indices, respectively.

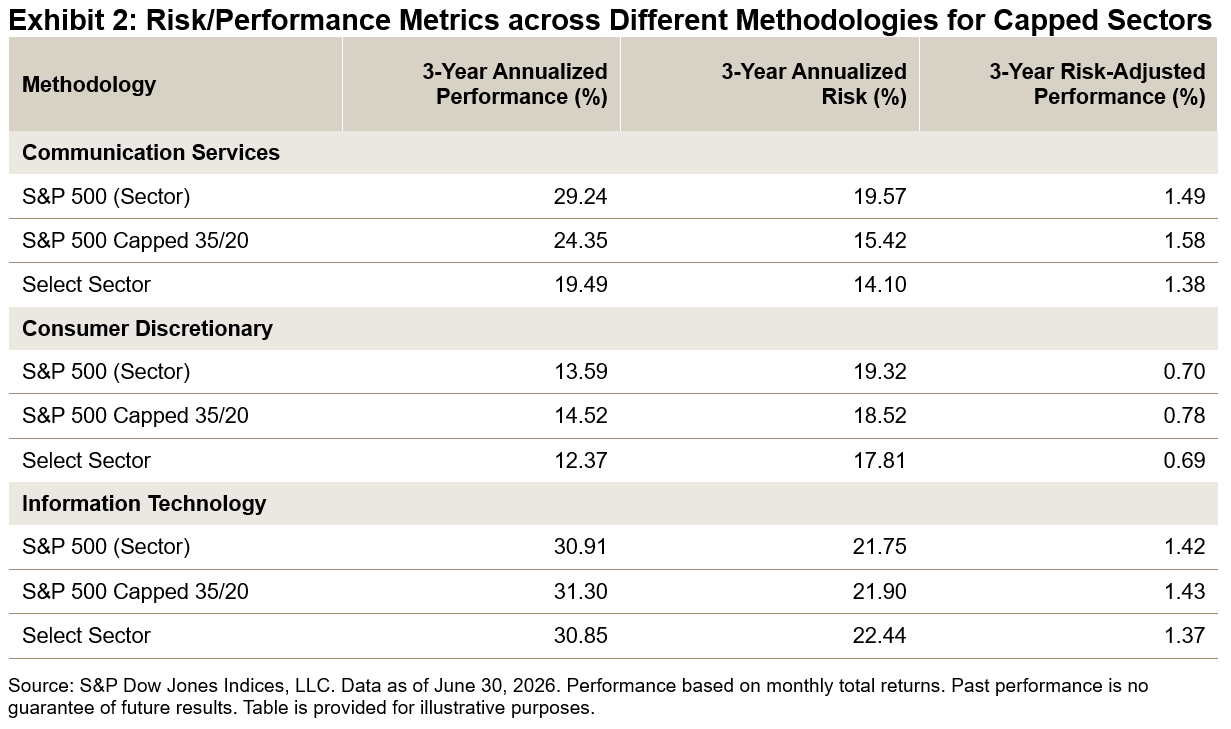
In sectors where capping has been triggered, the differences in constituent weights result in varying risk and performance profiles across the different methodologies. As the capping mechanisms act to redistribute weight away from the largest names, absolute performance can fluctuate depending on the relative performance of those companies versus their smaller peers over a given period. While this can lead to noticeable differences in absolute performance, risk-adjusted performance tends to align more closely across methodologies. Over the three-year period ending in June 2026, performance on this basis was largely similar, with the S&P 500 Capped 35/20 indices reflecting a marginally better performance per unit of risk in all three sectors compared to their uncapped and Select Sector counterparts.

Conclusion

The S&P 500 Capped 35/20 Indices measure S&P 500 sector constituents while utilizing a 35/20 capping framework that has historically provided diversification among companies within each index. By moderating single-stock dominance while maintaining weight in market leaders, the 35/20 methodology offers a more balanced approach to reflecting evolving market dynamics.

Disclaimer

S&P Dow Jones Indices is an index provider and does not provide investment advice. The index capping rules are designed to facilitate the ability of regulated investment companies to meet certain diversification requirements but do not guarantee compliance with the UCITS Directive or any other regulatory framework. Fund managers and other market participants remain solely responsible for ensuring that their products comply with all applicable regulatory requirements.

1 For the full index methodology of these indices, please see the S&P U.S. Indices Methodology.

2 For more information on capping thresholds, please refer to the Regulatory Capping Requirements section of S&P Dow Jones Indices’ Equity Indices Policies & Practices Methodology.

3 For further details of the Select Sector Indices, see Preston, Hamish “Explaining Changes to Select Sector Indices,” S&P Dow Jones Indices, Sept. 10, 2024.

The posts on this blog are opinions, not advice. Please read our Disclaimers.
2026 YTD Commodities Surge amid Renewed Inflation

Contributor Image
Nicholas Godec

Senior Director,​ Head of Fixed Income Tradables & Commodities

S&P Dow Jones Indices

S&P GSCI Outpaced BCOM, Stocks and Bonds

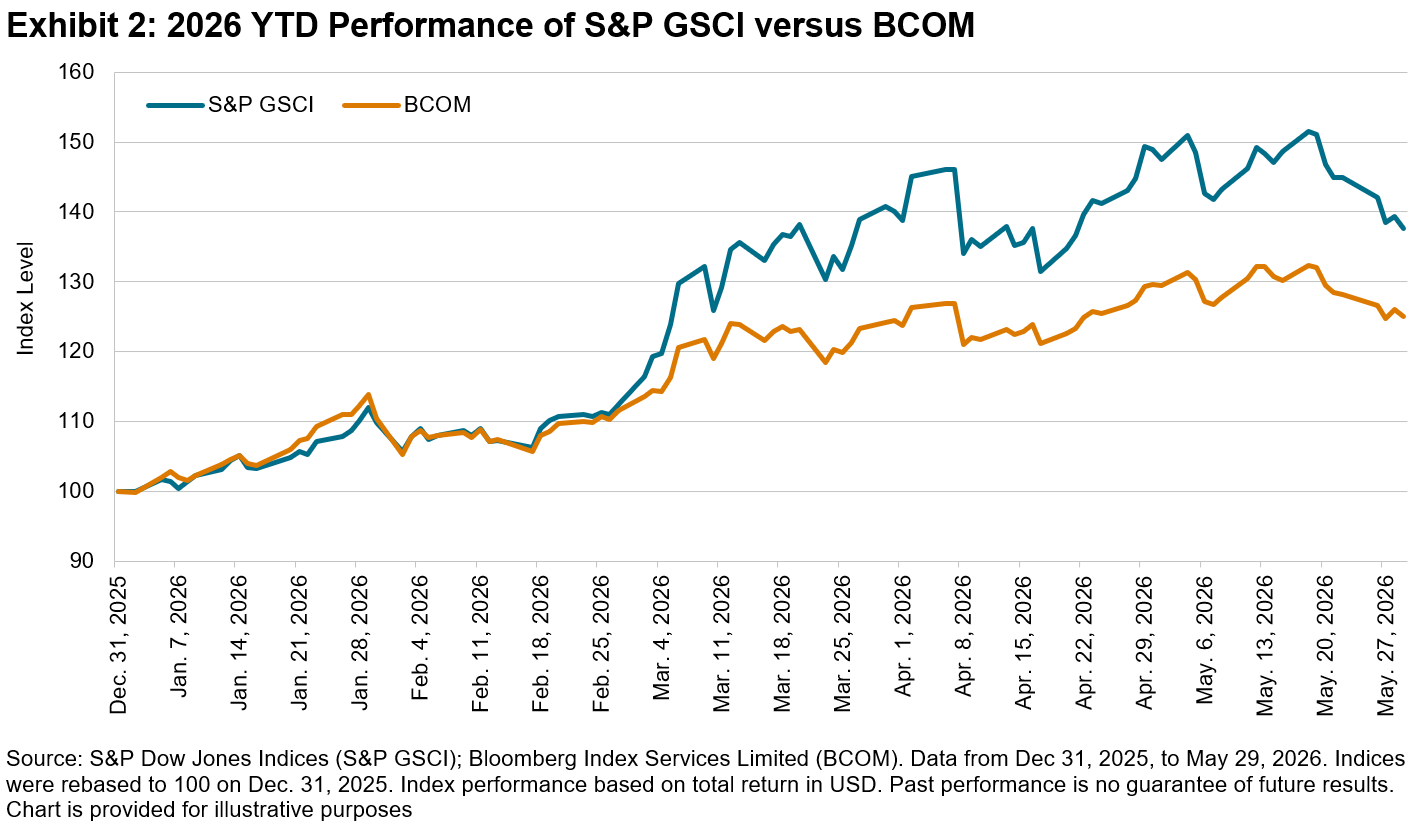
We recently published The S&P GSCI: Built for the Cycle, a 10‑year analysis of how broad commodity indices behaved across differing inflation regimes, and why the S&P GSCI’s production‑weighted design historically demonstrated a higher inflation beta than alternatives such as the Bloomberg Commodity Index (BCOM). This blog is a follow‑up, turning the focus to 2026 YTD performance. In the first five months of 2026, inflation re‑accelerated due to global conflicts constraining energy supplies. YTD performance aligned with findings explored in the longer study.

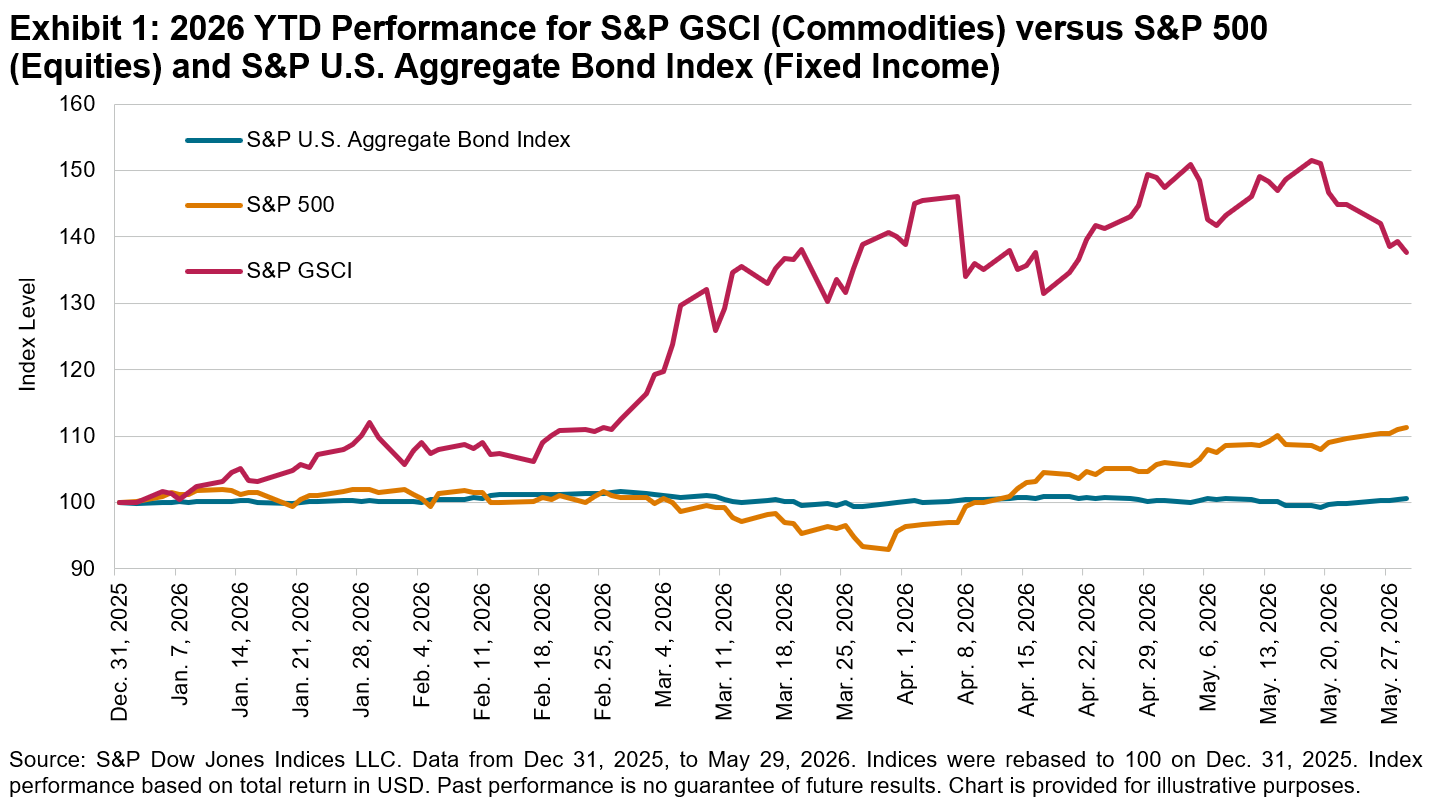
The S&P GSCI rose 37.7% through May 29, 2026, outperforming the Bloomberg Commodity Index (BCOM), which gained 25.0%. Both commodity benchmarks meaningfully outperformed equities (the S&P 500® was up 11.3%) and bonds (the S&P U.S. Aggregate Bond Index was up 0.6%) during the period. We’ll see how an inflation shock highlighted the inflation-hedging characteristics of commodities, the implications of production weighting in the S&P GSCI and the substantial contribution of the Energy sector to commodity performance.

Commodities Outperformed as Inflation Accelerated

After ending 2025 at about 2.7% year-over-year, U.S. consumer inflation (CPI-U) climbed to about 4.3% year-over-year by May 2026, an increase of 1.6 percentage points since the start of the year. A key driver was rising energy prices, due to a sharp oil price shock that rippled through broader prices.

Historically, inflation shocks have typically benefited commodities, and 2026 was a textbook example. Commodity performance took off in early 2026 as inflation rose. By late March, the S&P GSCI TR had climbed to double-digit gains, peaking in mid-May with a YTD increase of over 50% before settling at 37.7% at the end of May. In contrast, the S&P 500 TR ended May up a solid but considerably lower 11.3%, while the S&P U.S. Aggregate Bond Index was essentially flat (up 0.6%) over the same period. In short, commodities (especially those that are Energy driven) significantly outperformed traditional assets during this inflationary spike.

GSCI versus BCOM: Production Weighting Shows Its Value

Within commodities, the S&P GSCI outpaced BCOM YTD in 2026, continuing a familiar pattern from the past decade. Through the end of May, the S&P GSCI’s gain of 37.7% topped the BCOM’s 25.0% by over 12 percentage points. This outperformance under inflationary conditions is consistent with the findings of the 10-year analysis: the S&P GSCI’s inflation beta was about 1.7× higher than the BCOM’s (9.1 versus 5.5, respectively), meaning that the S&P GSCI has historically moved about 65% more for each 1% move in inflation. The 2026 YTD data were consistent with this relationship, with the S&P GSCI reacting more strongly to the inflation surprise than BCOM.

To explain the S&P GSCI’s outperformance, we can point to the production-weighted structure embedded in the index weighting scheme, which may have contributed to relative performance when inflation-hedging characteristics were particularly relevant. This result is consistent with findings from the past decade—the S&P GSCI has exhibited stronger performance in higher-inflation regimes.

Energy Takes the Lead in 2026

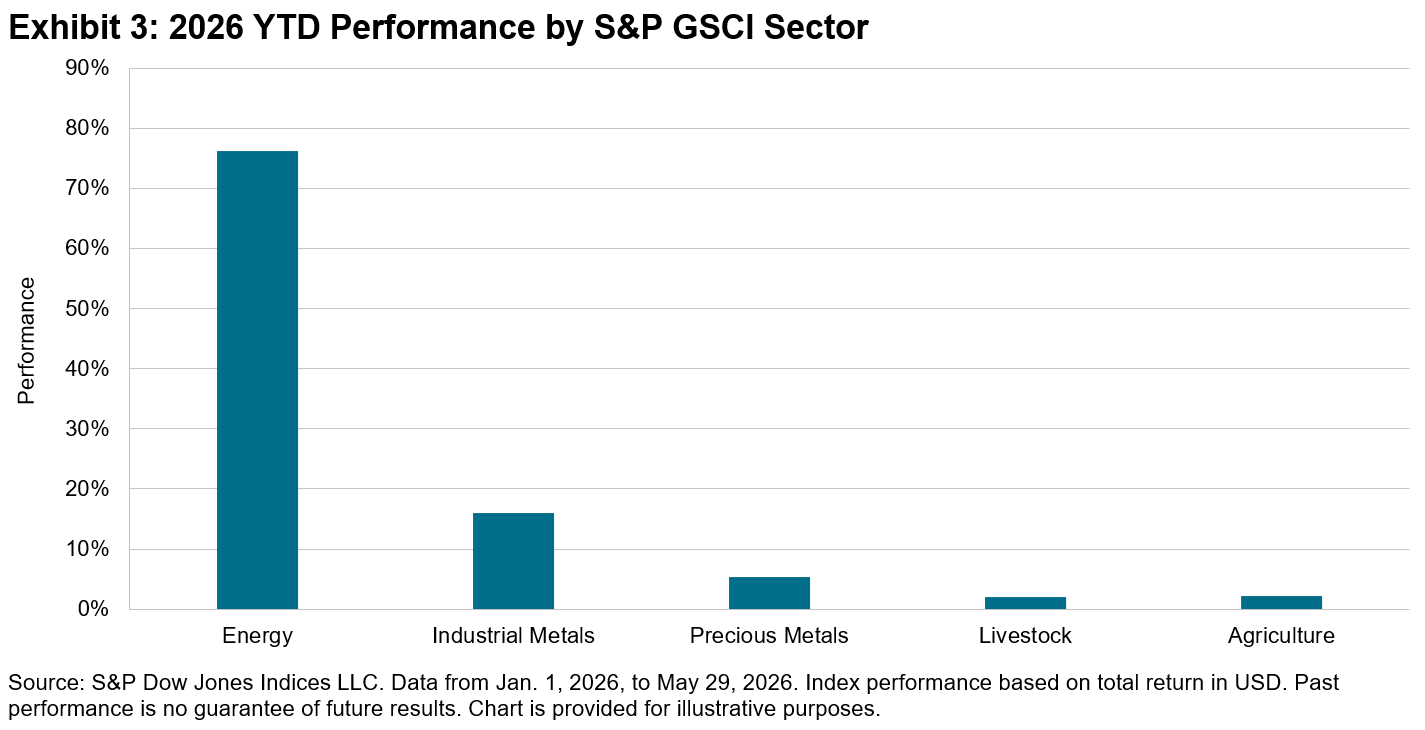
The 2026 commodity rally was led by Energy. Within the S&P GSCI, the Energy sector gained 76.3% through the end of May, significantly exceeding the gains in all other sectors. For context, Industrial Metals was up 16.0%, Precious Metals rose 5.3%, and Agriculture and Livestock each climbed roughly 2% YTD.

These figures are consistent with the central findings of The S&P GSCI: Built for the Cycle, which highlighted how production weighting aligns a commodity index with the real-economy cost structure. When Energy prices have risen, an index weighted by the scale of global production tended to reflect that move in proportion to Energy’s economic footprint. The heavy Energy weight in the S&P GSCI is an important characteristic of inflation-responsive commodity weighting. Of course, greater sensitivity means accepting higher volatility, but as YTD 2026 has shown, the advantages could be significant during inflationary surges.

This content may be AI-assisted and is composed, reviewed, edited, and approved by S&P Global.

The posts on this blog are opinions, not advice. Please read our Disclaimers.

S&P 500: America's Benchmark

Cathy Clay, CEO of S&P Dow Jones Indices, and Lynn Martin, President of the NYSE Group, recently met on the trading floor of the New York Stock Exchange to discuss how the S&P 500 connects America’s past, present and future.  

Drawing on the index’s nearly 70-year legacy, they examine what has made the benchmark so iconic—its role in helping Americans participate in the economy, the enduring strength of the NYSE Group and S&P Dow Jones Indices partnership, and the way it continues to serve as a trusted compass for today’s markets. 

The posts on this blog are opinions, not advice. Please read our Disclaimers.
The Case for the S&P Dividend Aristocrats in Today’s Market

Contributor Image
Kevin Multhaup

Senior Analyst, Factors and Dividends Indices

S&P Dow Jones Indices

With broad market benchmarks trading at historically low yields and elevated valuations, it’s timely to examine the performance of the S&P Dividend Aristocrats® Index Series in today’s market environment. These indices track companies with a consistent record of dividend growth and currently offer a combination of strong yields and reasonable valuations. Historically, they have also exhibited defensive qualities, which is relevant in an environment characterized by market volatility and a risk of pullbacks. Furthermore, as benchmark concentration has risen and technology stocks have come to dominate broad market indices, dividend-focused strategies show diversification characteristics owing to their broad sector profiles and sources of performance.

Methodology Review

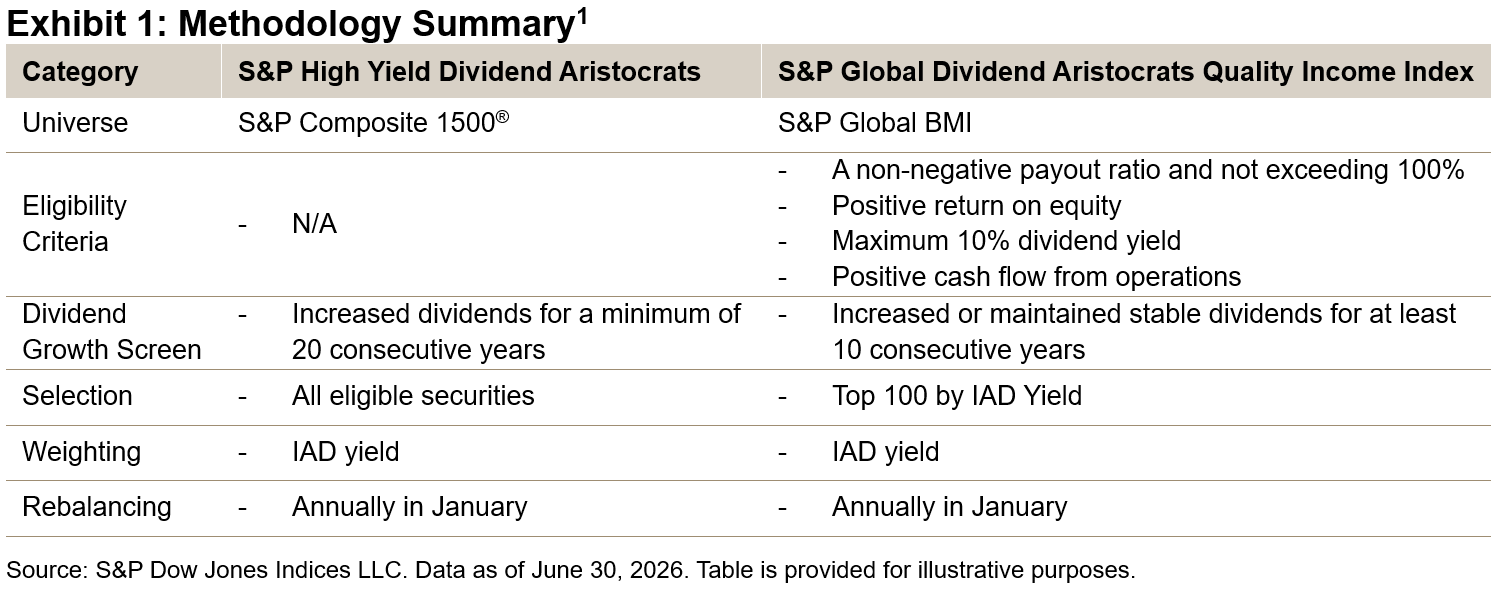
The S&P Dividend Aristocrats Indices track companies that have followed a managed-dividends policy of consistently increasing dividends every year for several years. The S&P High Yield Dividend Aristocrats considers 20 consecutive years of increasing dividends, whereas the S&P Global Dividend Aristocrats Quality Income Index requires 10 consecutive years of increasing or stable dividends, alongside fundamentals-based quality metrics focused on assessing the sustainability of companies’ dividend payout policies. Both indices are weighted by indicated annual dividend yield (IAD yield), helping maintain a strong focus on income while prioritizing inclusion of companies with demonstrated dividend growth characteristics.

Dividend Yields Significantly Exceed Benchmark Universes

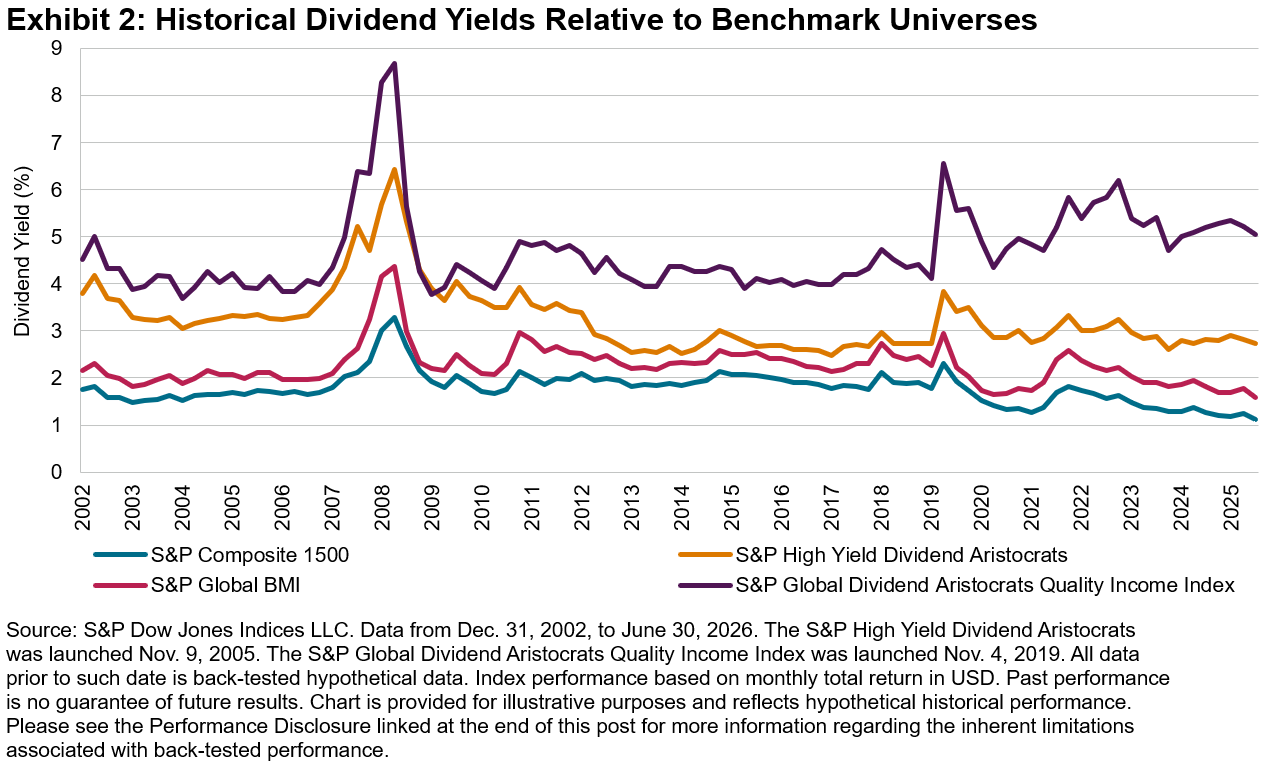
Dividend yield is a core metric for any income-focused strategy. Both the S&P High Yield Dividend Aristocrats and the S&P Global Dividend Aristocrats Quality Income Index have historically posted yields over twice those of their respective benchmarks (see Exhibit 2).

Valuations Remain Strong Relative to Benchmarks

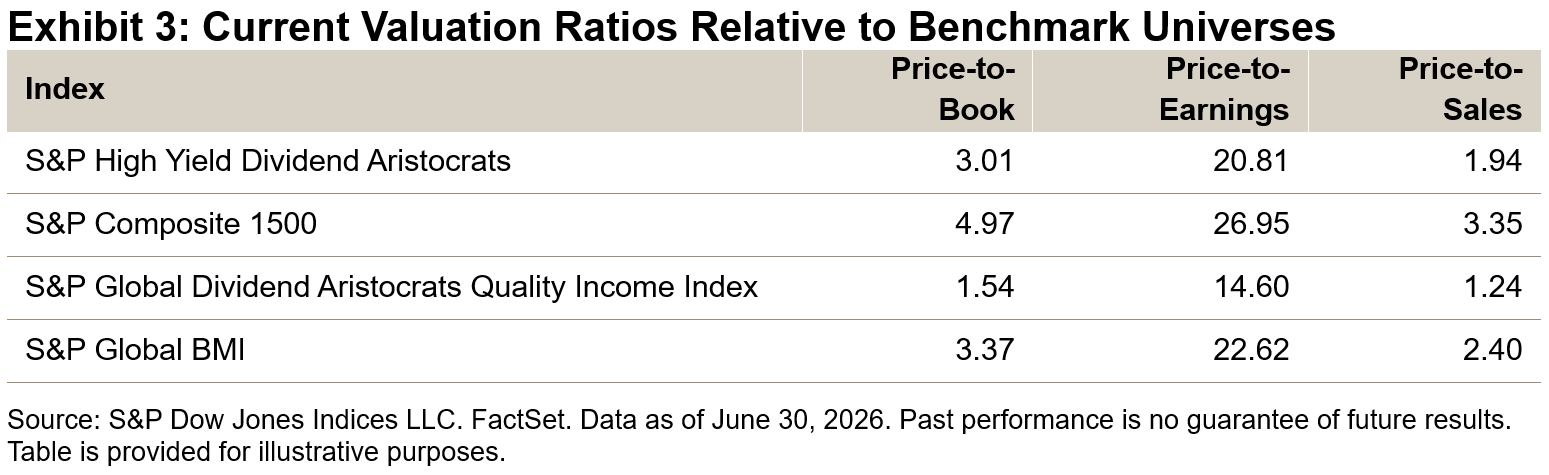
Following an extended bull market and historically elevated valuations—particularly within the Information Technology sector—Exhibit 3 highlights that both indices continue to trade at meaningful valuation discounts relative to their respective benchmark universes.

Sector Diversification

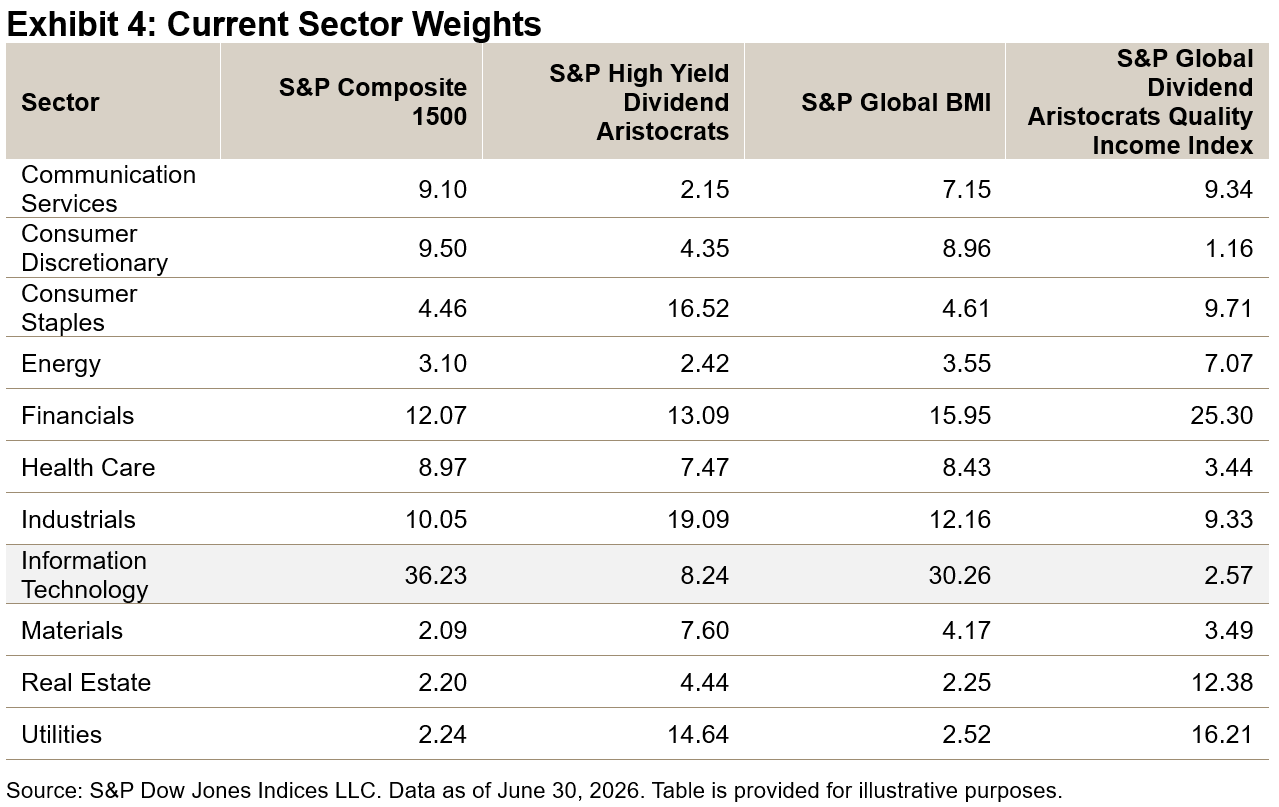
Exhibit 4 shows the diversification characteristics of these indices, demonstrating a significant underweight in Information Technology while increasing weight in traditionally defensive sectors such Consumer Staples and Utilities.

Assessing Historical Defensive Characteristics

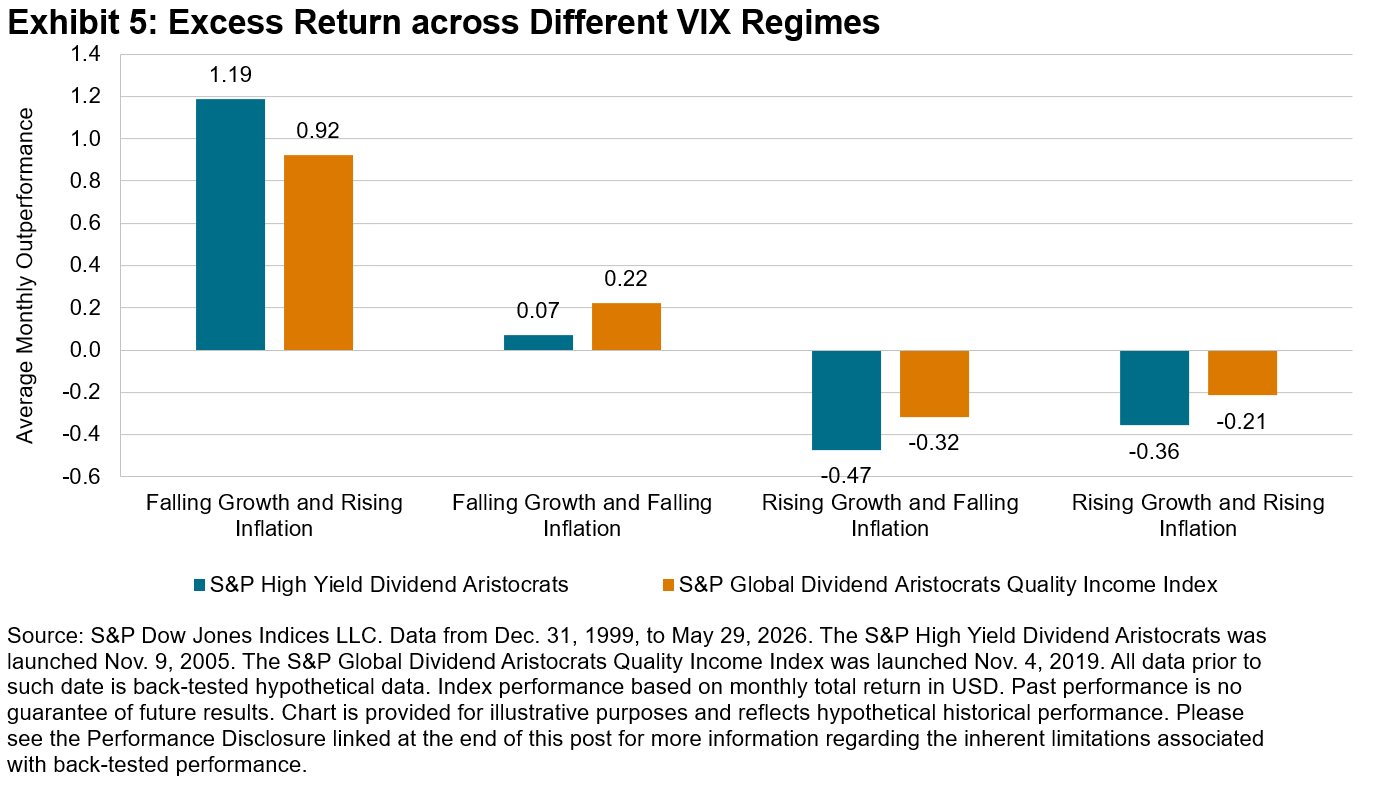
The S&P Dividend Aristocrats Indices have historically demonstrated stronger performance in weaker markets. Both indices have often delivered better relative performance during periods of higher volatility—especially when VIX® rises above 20, a level often linked to increased market stress (see Exhibit 5).

Examining Performance over the Long Term

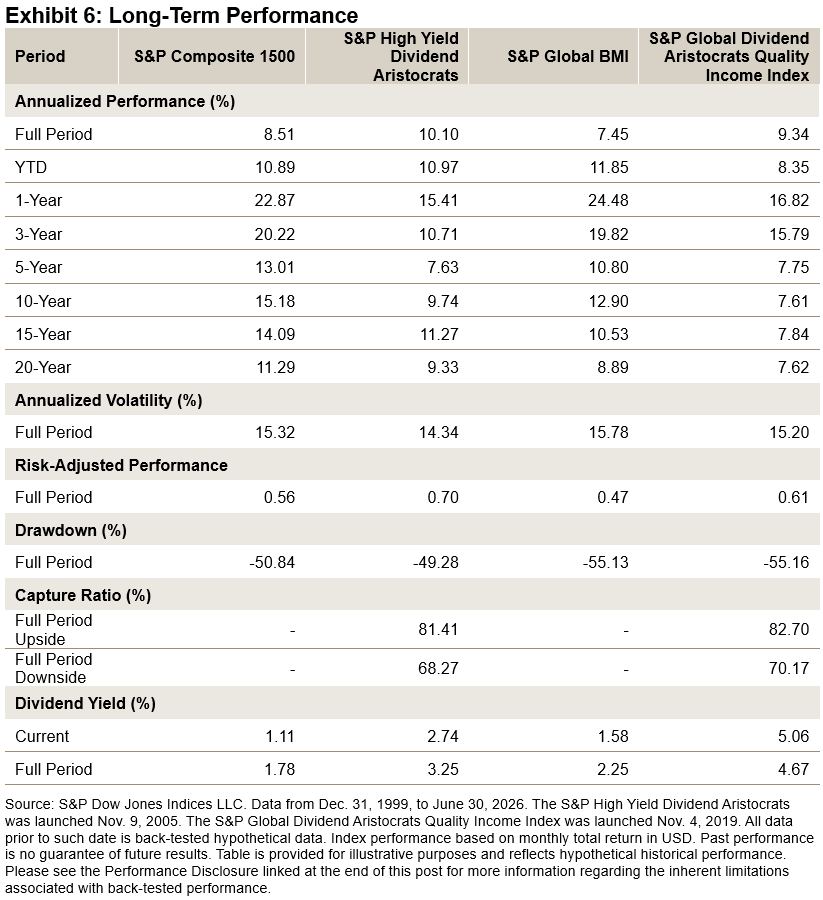
Over the long term, both the S&P High Yield Dividend Aristocrats and S&P Global Dividend Aristocrats Quality Income Index have outperformed their respective benchmarks on an absolute and risk-adjusted basis (see Exhibit 6).

Conclusion

Strong Q1 2026 inflows into dividend strategies suggest renewed demand for income and defensiveness amid heightened volatility and evolving macroeconomic conditions. The S&P Dividend Aristocrats Indices methodology focuses on companies with durable dividend growth and consistent income—traits often associated with mature, stable companies—which tend to have more robust operating models and have historically shown resilience in difficult markets while providing a measure of consistent dividend yield and diversification.

1 Please see the S&P Dividend Aristocrats Indices Methodology for more information.


The posts on this blog are opinions, not advice. Please read our Disclaimers.