







What’s driving growth in ETF usage among insurers to all–time highs? S&P DJI’s Anu Ganti and Nick Didio share key takeaways across asset class, company size and geography from their latest research, “ETFs in Insurance General Accounts – 2026.”
The posts on this blog are opinions, not advice. Please read our Disclaimers.Exploring the Rise of ETF Usage in Insurance General Accounts
S&P DJI’s Global Islamic Benchmarks Outperformed Conventional Peers in H1 2026
Why U.S. Sectors Matter to Europe
Finding the Golden Mean with a Buffered Strategy
Parsing Productive Assets with the S&P Pantera Digital Asset Index
Exploring the Rise of ETF Usage in Insurance General Accounts
S&P DJI’s Global Islamic Benchmarks Outperformed Conventional Peers in H1 2026

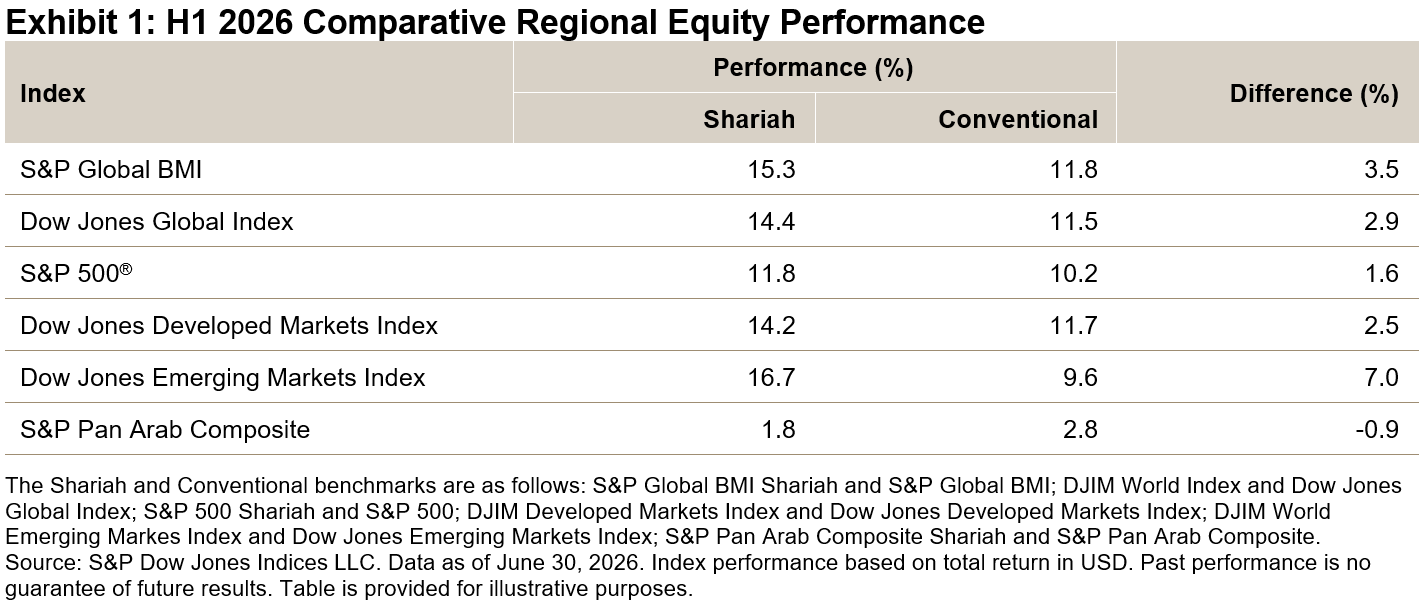
Global equities showed solid gains in the first half of 2026, supported by strong earnings in semiconductor-related industries. Conventional benchmarks rose across regions, with both global and developed markets posting double-digit gains, while emerging markets advanced at a slower pace, partly reflecting U.S. dollar strength. MENA equities continued to lag, weighed down by geopolitical tensions (see Exhibit 1).
Shariah-compliant equities outperformed conventional benchmarks across most major regions. The S&P Global BMI Shariah rose 15.3%, outperforming its benchmark, the S&P Global BMI, by 3.5%, while the Dow Jones Islamic Market (DJIM) World Index outperformed the Dow Jones Global Index by 2.9%. In developed markets, Shariah indices also modestly outpaced conventional peers, while the most pronounced gains were in emerging markets, where excess performance reached 7.0%. The MENA region remained the exception, showing modest underperformance (see Exhibit 1). See the Q2 2026 S&P Shariah and Dow Jones Islamic Market Indices Scorecard for more performance details.
Drivers of Shariah Index Performance in H1 2026
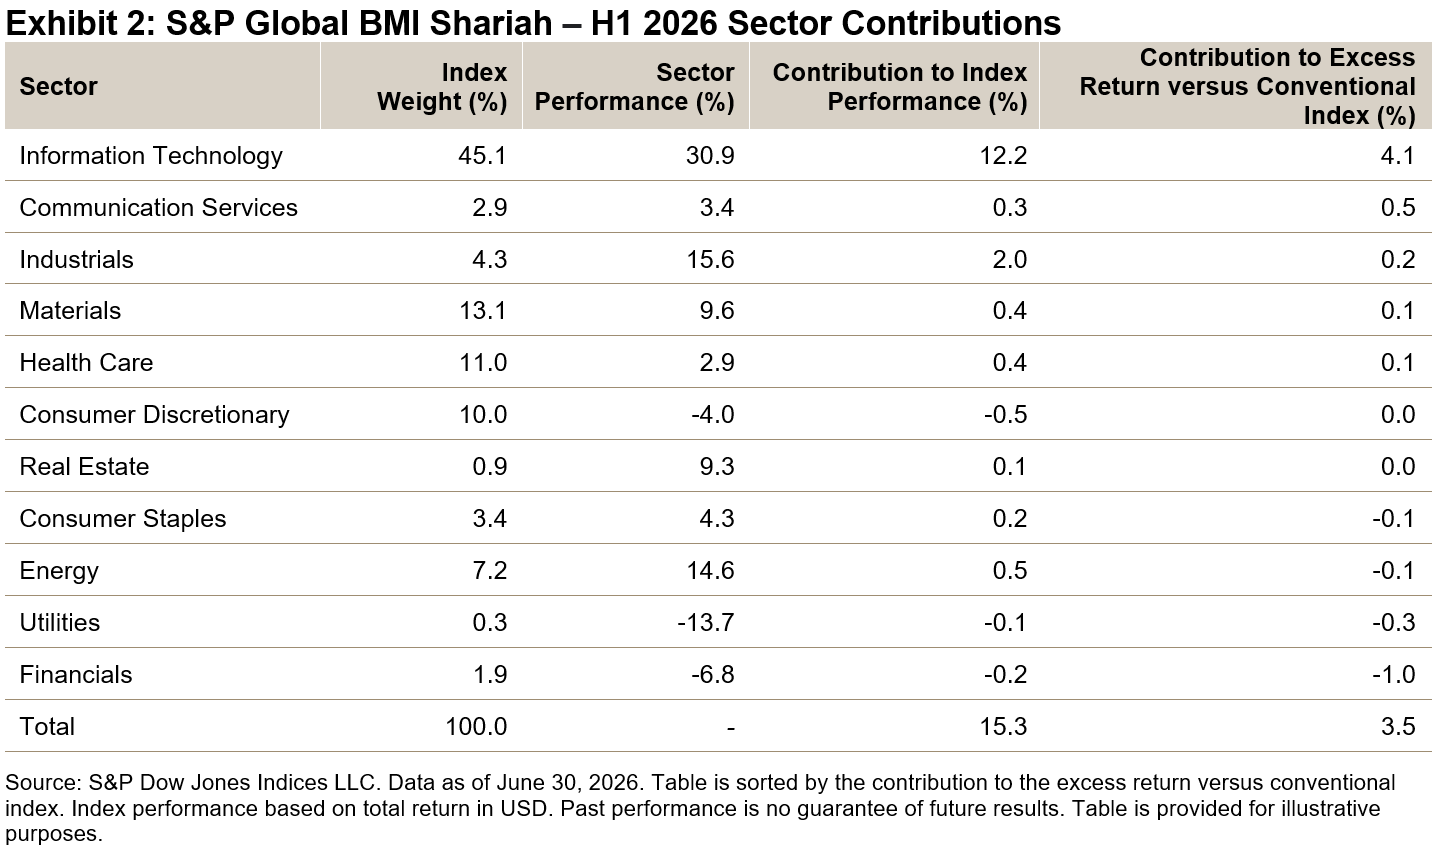
Sector positioning was a key driver of relative performance (see Exhibit 2). Information Technology—accounting for over 45% of the S&P Global BMI Shariah—rose 30.9% and contributed more than 12.2% to the index’s overall performance. Communication Services also supported relative gains, benefiting from stronger performance differentials versus conventional counterparts.
Conversely, structural underweights created headwinds. Limited weight in Financials and Utilities detracted 1.0% and 0.3% from excess performance, respectively, due to both underperformance versus conventional counterparts and lower weights.
Global Sukuk Posted Modest Gains
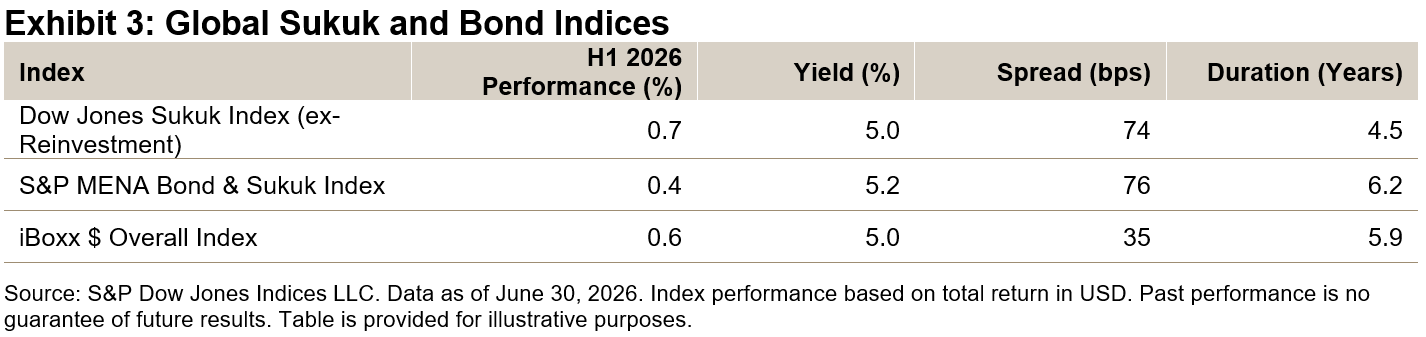
In fixed income, global markets experienced increased volatility amid sharp moves in oil prices and related uncertainties around inflation and policy rates. Investment grade bonds and sukuk performed modestly, with the iBoxx $ Overall Index and Dow Jones Sukuk Index (ex-Reinvestment) rising 0.6% and 0.7%, respectively. Yield levels remained comparable at around 5%, with sukuk offering higher spreads but shorter duration profiles (see Exhibit 3).
This article was first published in IFN Volume 23 Issue 29 dated July 22, 2026.
This content may be AI-assisted and is composed, reviewed, edited, and approved by S&P Global.
The posts on this blog are opinions, not advice. Please read our Disclaimers.Why U.S. Sectors Matter to Europe

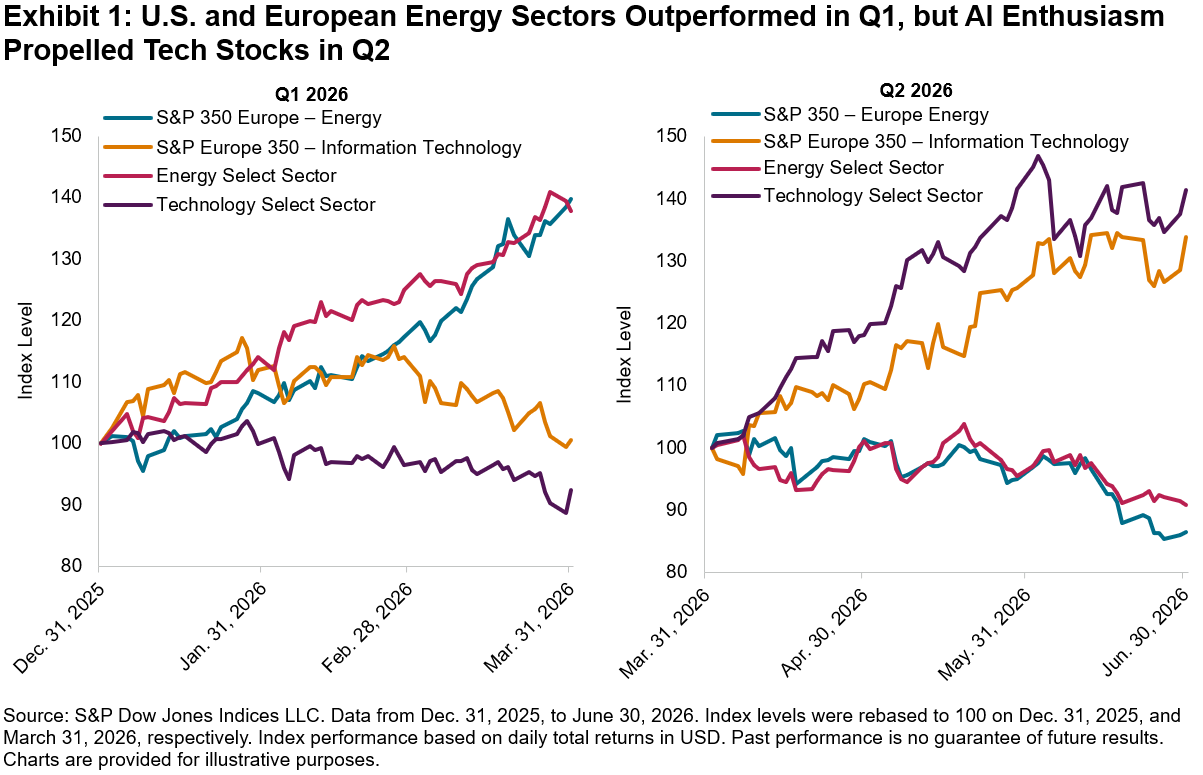
The first half of 2026 was notable for U.S. equity markets1 and was characterized by sharp sector performance reversals, particularly in S&P 500® Information Technology and S&P 500 Energy. Both sectors were up 20% YTD through Q2,2 but they took very different paths to get there.
During the first quarter, Energy stocks had an outsized effect on the broader market as oil supply shortages, fueled by the war in Iran, rippled through supply chains. This pushed the Energy Select Sector up 38%, while the Technology Select Sector declined 8%. The tide turned in Q2 when enthusiasm surrounding AI companies and their related dependencies sparked a major turnaround in the Technology sector, sending the Technology Select Sector up 43%, while the Energy Select Sector fell 13% due to retreating oil prices and easing geopolitical concerns.
Looking across the pond, similar trends were observed in Europe. The S&P Europe 350 – Energy was up 40% in USD terms in Q1 while the S&P Europe 350 – Information Technology rose 42% in Q2.
Despite their similar sector co-movements in the short term, the historical outperformance of S&P 500 compared to the S&P Europe 3503 highlights the relevance of U.S. equities for European market participants (see Exhibit 2).
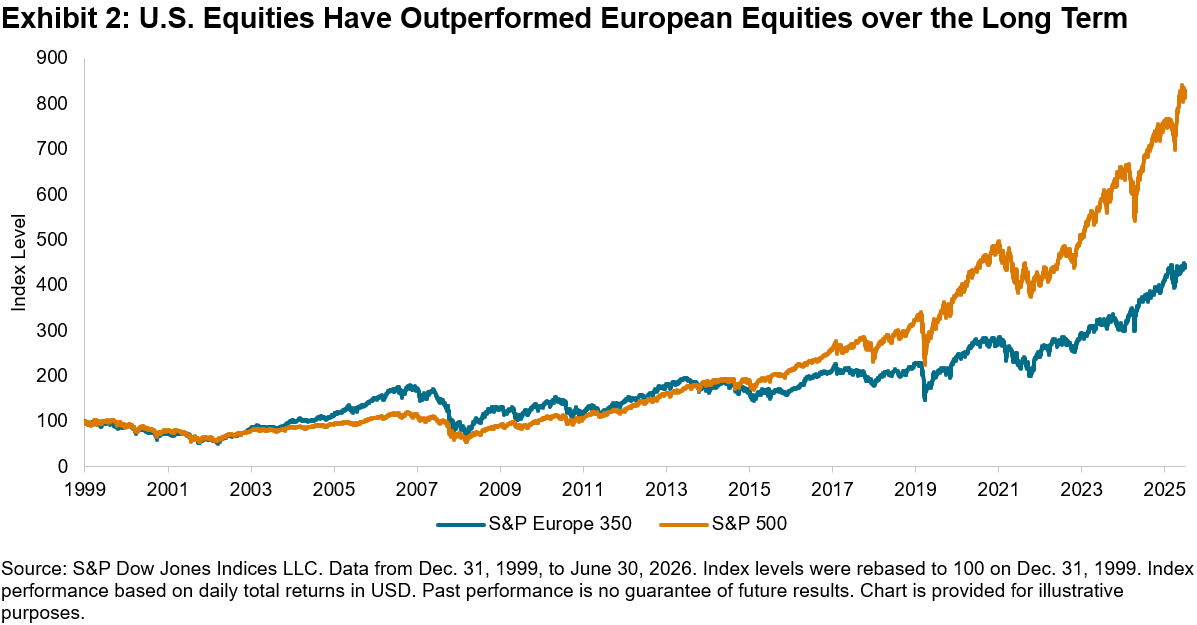
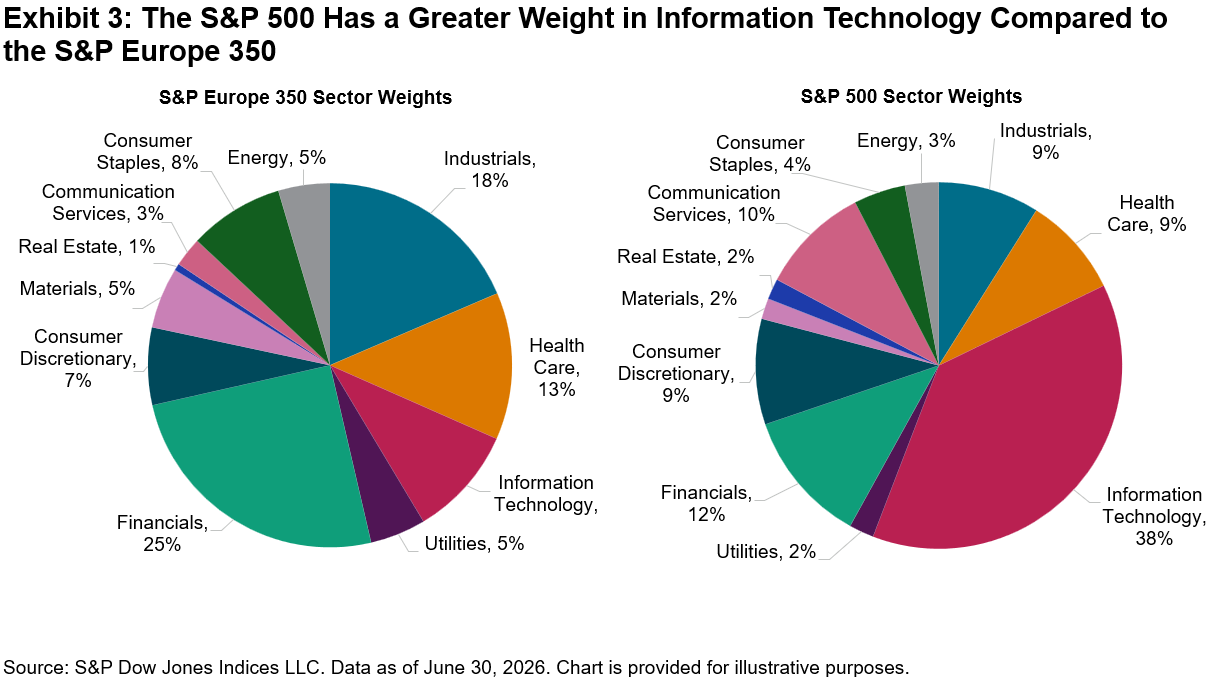
Adopting a sectoral perspective can help explain the long-term outperformance of the S&P 500 versus the S&P Europe 350. Exhibit 3 shows that the S&P 500 is concentrated in Information Technology, while the S&P Europe 350 has a greater weight in Financials and Industrials.
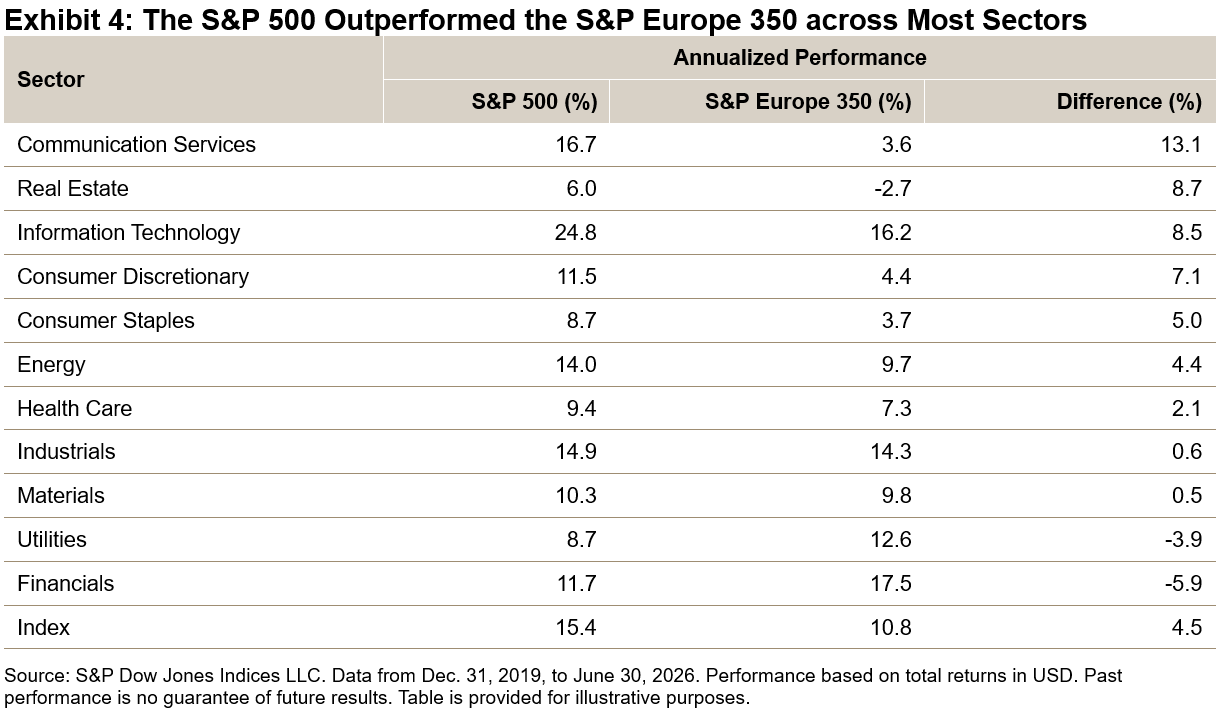
Another explanation for the S&P 500’s historical outperformance is its comparatively stronger within-sector performance. In fact, since 2020, 9 of the 11 GICS® sectors in the S&P 500 outperformed their European peers.
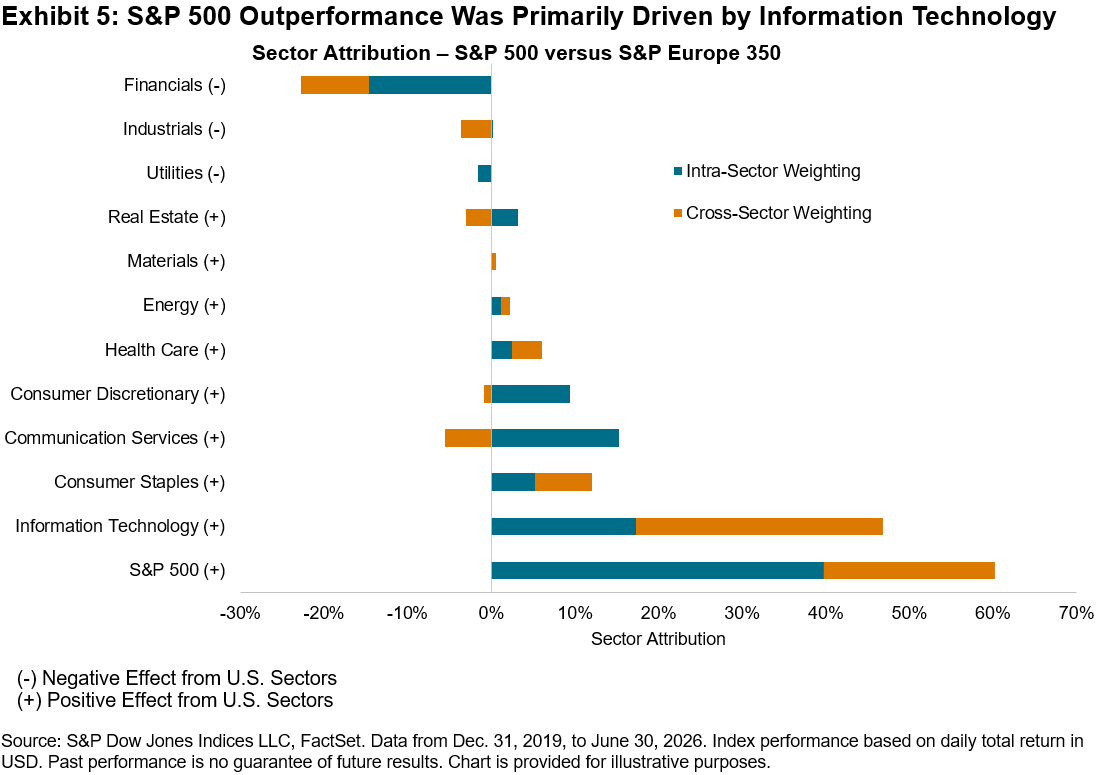
Notably, Exhibit 5 shows that the overweight to Information Technology and the outperformance of stocks within the sector accounted for a large portion of the S&P 500’s outperformance versus the S&P Europe 350.
Recently, heightened geopolitical concerns and fluctuating oil prices have put the Energy sector back in the spotlight, while recent AI-related jitters have caused a pullback in Information Technology in both the U.S. and Europe. While we don’t know if another reversal4 is in order, evaluating the U.S. market through a sectoral perspective offers important context for European market participants.
1 For more information, see our U.S. Dashboard.
2 For more information, see our U.S. Sector Dashboard.
3 Tim Edwards et al., “Why Does The S&P 500 Matter to the U.K.?” S&P Dow Jones Indices LLC., Jan 17, 2023.
4 Anu Ganti, “Regimes, Reversals and Risk”, S&P Dow Jones Indices LLC., July 9, 2026.
The posts on this blog are opinions, not advice. Please read our Disclaimers.Finding the Golden Mean with a Buffered Strategy
For many market participants, the priority is not pursuing every inch of a bull market run but rather participating while managing downside risk. This desire for a more predictable investment experience has contributed to the growth of buffered (or defined outcome) strategies, which aim to balance participation in market gains with a defined level of protection against losses.
What Is a Buffered Strategy?
A buffered strategy combines equity investment (such as one that tracks the S&P 500®) with a series of options designed to shape the potential outcomes. Typically, this involves positions in three options with the same maturity (e.g., one year): buying a protective put option, and selling a further out-of-the-money put option and an out-of-the-money call option to finance the purchase. The resulting payoff profile has three key features.
- Buffer: Protection against moderate declines. For example, the S&P 500 10% Buffered Index Series targets a fixed downside protection of up to 10% of any decline in the underlying index at the option expiration.
- Cap: A limit on upside participation, reflecting the cost of downside protection.
- Market Exposure beyond Thresholds: Declines beyond the buffer are not mitigated, with no participation in gains above the cap.
The result is a narrower payoff profile, allowing market participants to trade off upside potential for a more defined range of outcomes.1
Why Use Buffered Strategies?
While the primary motivation is risk management, a secondary reason can be building for the long term: by moderating the impact of downturns, buffered strategies may help maintain long-term participation in market gains.
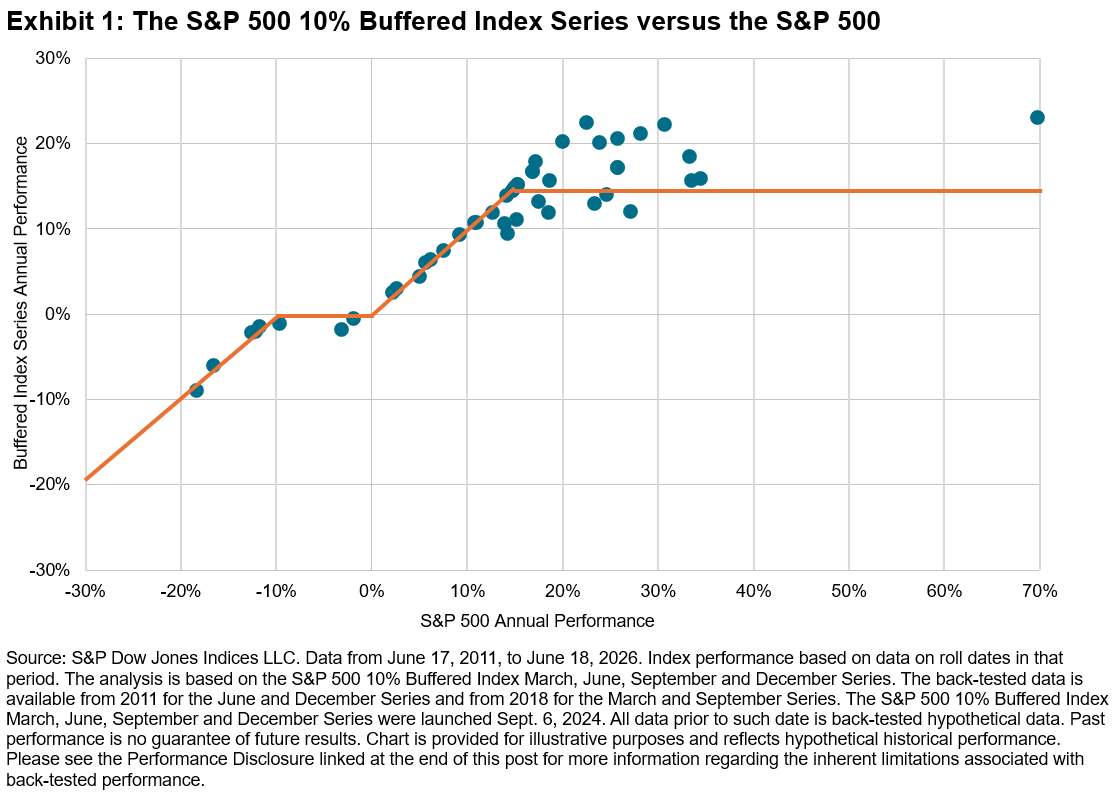
Exhibit 1 compares the performance of the S&P 500 10% Buffered Index Series with the S&P 500 between rebalance dates. The index is designed to track the S&P 500 in years of modest gains while mitigating losses in years of modest declines. The downside protection feature has provided outperformance during market downturns, although some of those periods still produced negative results. Conversely, capped upside participation has led to underperformance during strong bull markets.
How Often Do Such Strong Bull Markets Occur?
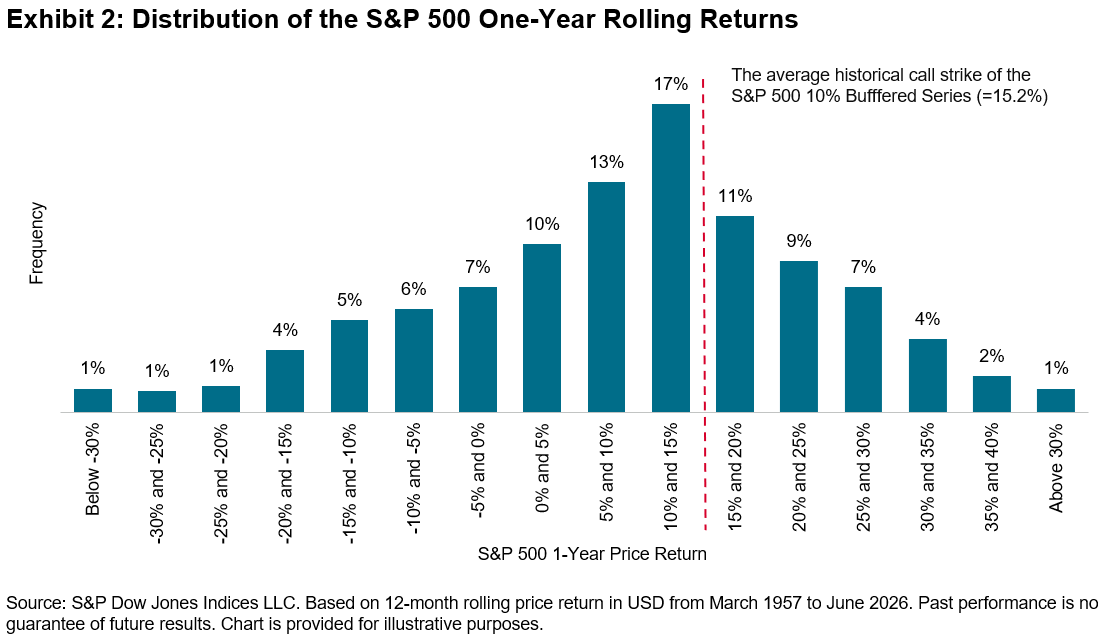
To illustrate the trade-off between capped upside and downside protection, Exhibit 2 shows the historical distribution of one‑year rolling performance for the S&P 500 from March 1957 to June 2026.
- The average one-year gain was 8.9%, with a median of 10.6%.
- By comparison, the historical average call strike for the S&P 500 10% Buffered Index Series was 15.2%.2
This suggests that the S&P 500 10% Buffered Index Series may have matched or exceeded the S&P 500 in more than half of these one‑year windows on an absolute return basis—assuming the rebalancing horizon aligned with the one‑year period. Consistent with this observation, the S&P 500 10% Buffered Index Series matched or outperformed the S&P 500 in 52% of the one‑year intervals shown in Exhibit 1 between June 2011 and June 2026.
Risk-Adjusted Performance
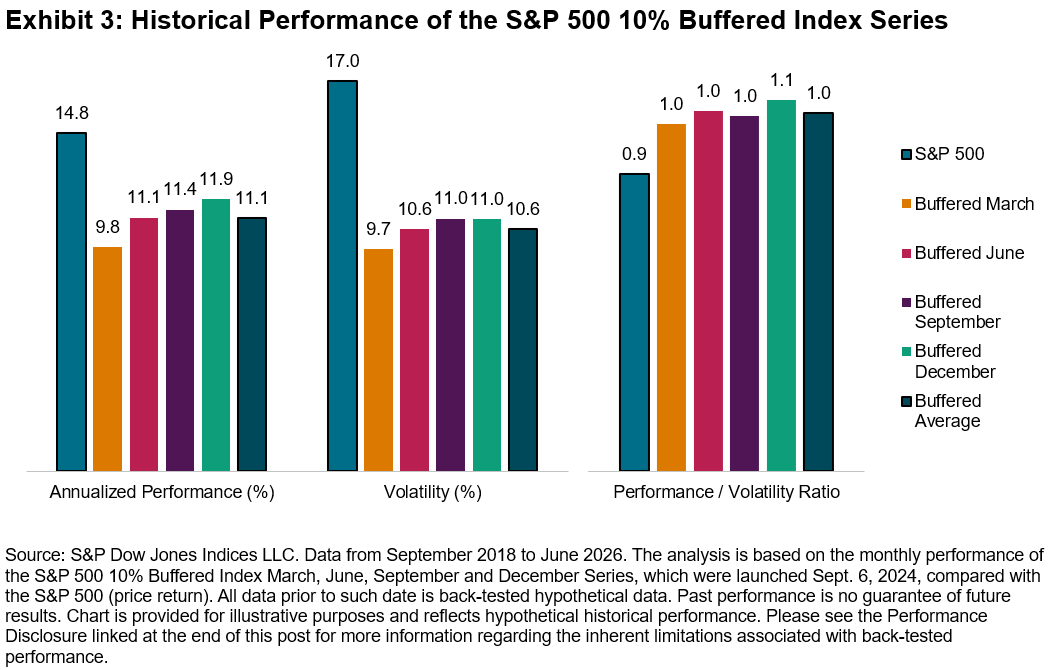
Buffered strategies may also be evaluated through a risk-adjusted lens. From September 2018 to June 2026:
- The S&P 500 posted an annualized performance of 14.8% with 17.0% volatility.
- The S&P 500 10% Buffered Index Series averaged 11.1% performance with 10.6% volatility.
While historical performance was lower in absolute terms, the reduction in volatility resulted in higher performance-to-risk ratios compared with the broad equity market.
Hypothetical Portfolio Implications
Buffered strategies can also play a role in portfolio construction. Their distinct risk/return profiles and correlation dynamics may complement traditional equity and fixed income exposures. In environments where equity and bond correlations remain elevated, narrowing the range of potential outcomes for equity allocations may be particularly relevant.
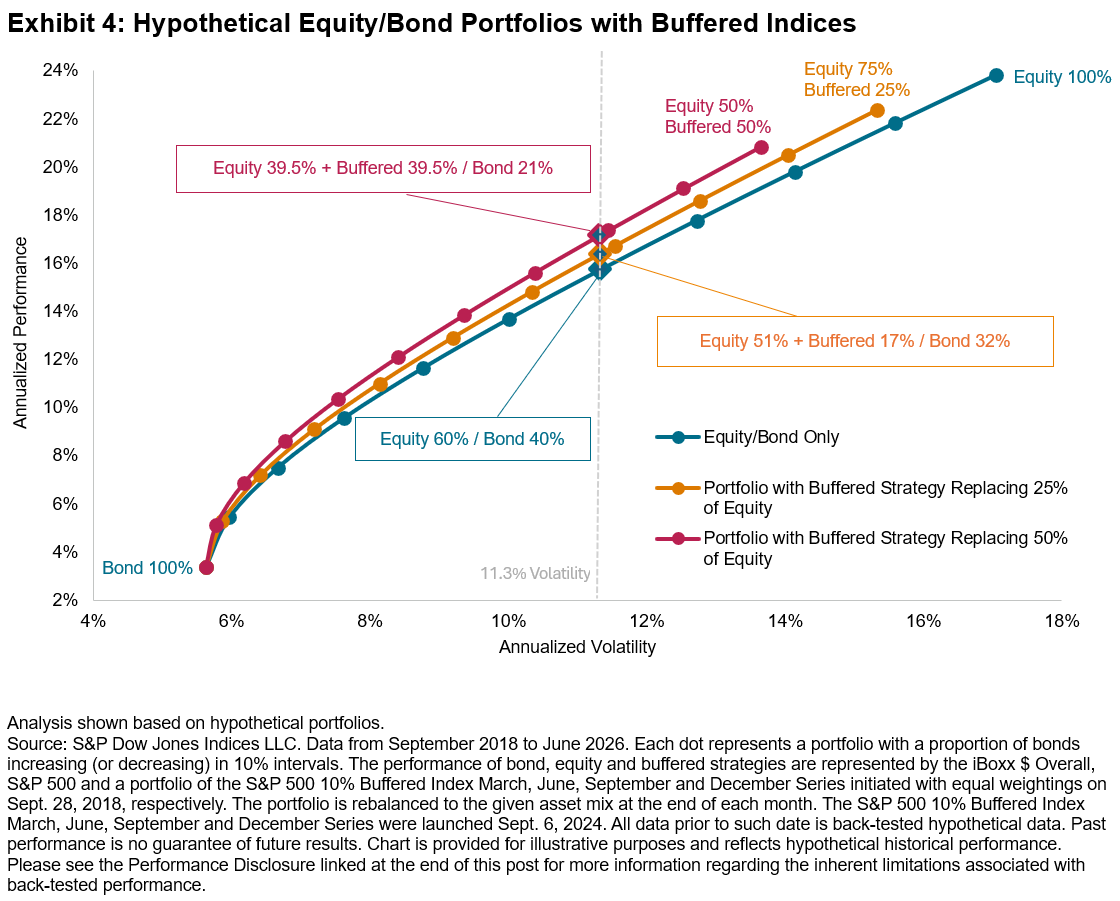
As an illustration, if a classic 60/40 equity/bond index mix was hypothetically augmented to include a buffered allocation, it could have raised the effective equity exposure while maintaining similar volatility levels, resulting in higher hypothetical risk-adjusted performance (see Exhibit 4). This reflects the potential for buffered strategies to act as a bridge between growth-oriented and defensive allocations.
In short, buffered indices provide a transparent, rules-based framework for benchmarking and analyzing the potential outcomes from buffered strategies. By combining equity with option overlays, they reflect a structured approach to balancing participation and protection. For a deeper dive into buffered indices, please see “Defining Paths with Options-Based Index Strategies.”
1 See “Introducing the S&P 500 Defined Outcome Index Series” for the examples of S&P DJI’s buffered indices
2 The average call option strike price is calculated based on the back-tested data of the S&P 500 10% Buffered Index March, June, September and December Series between June 2011 and December 2025.
The posts on this blog are opinions, not advice. Please read our Disclaimers.Parsing Productive Assets with the S&P Pantera Digital Asset Index

Moving beyond Narrative: A Fundamental Lens on Digital Assets
Digital asset markets have evolved rapidly, but the tools used to evaluate them have not kept pace. Many crypto strategies have historically been shaped by market narratives, momentum or broad exposure to the largest tokens.1 Designed with the crypto and blockchain investment firm Pantera Capital and powered by Artemis Analytics data, the S&P Pantera Digital Asset Index takes a different approach: it measures the market performance of a subset of digital assets that demonstrate observable and recurring economic activity through protocol-level revenue generation.
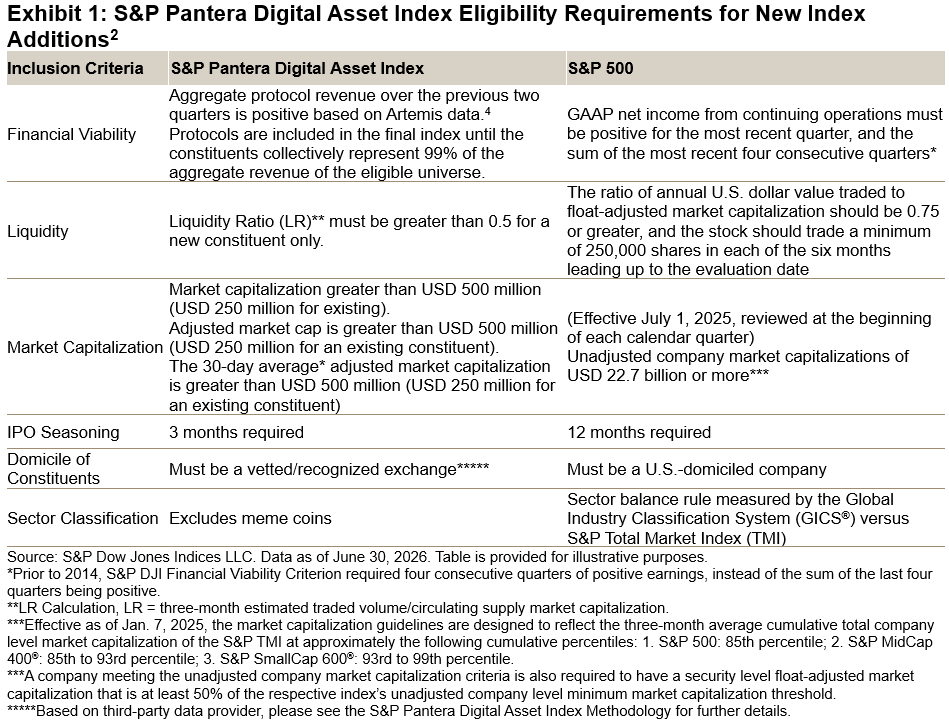
In traditional equity markets, investors often look for evidence of fundamental strength through measures such as revenues, earnings, margins or cash flows. Digital assets do not map as neatly onto that framework, but some protocols do generate measurable economic activity through mechanisms such as transaction fees, token burns or other protocol-level revenue streams. The S&P Pantera Digital Asset Index uses this activity as an indicator of financial viability, mirroring the higher entry threshold of the S&P 500® compared to other U.S. equity indices2 alongside standard index construction toolkits related to investability criteria and diversification.
Constructing the S&P Pantera Digital Asset Index
The starting universe, the S&P Cryptocurrency Broad Digital Asset (BDA) Index, applies a base level of filters to remove smaller assets. One unique feature of digital assets is that the barrier to creating a tradable token is extremely low. Unlike public equities, where exchange listings come with baseline disclosure requirements and business standards, crypto offers no equivalent universal filter. The S&P Pantera Digital Asset Index has a seasoning rule of three months and constituents must be listed on a vetted exchange, recognizing that some newly launched crypto projects may achieve high market capitalization and liquidity in the very short run post-initial coin offering (ICO). Please see the S&P Pantera Digital Asset Index Methodology for more details.
Composition and Constituents of the S&P Pantera Digital Asset Index
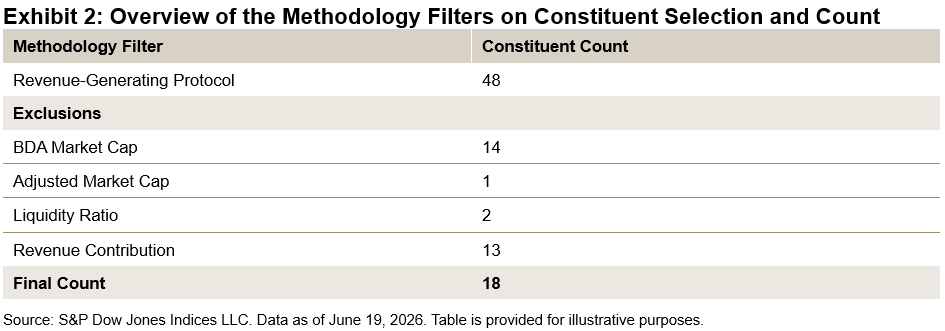
Here we look at the impact of the index filters on the final composition. The index doesn’t apply a fixed count, allowing constituents that meet the thresholds to be added over time. The current constituent count as of the June 2026 rebalance was 18, with a minimum constituent count of 5. While the early history had few protocols, over the last two years, the constituent count has been consistently above 10, perhaps indicating the increased maturity of the type of protocols available to market participants. While the number of protocols in our initial revenue pool was 48, around 15 were dropped based on the underlying benchmark and adjusted market cap, 2 failed to meet the liquidity threshold and 13 were excluded as their revenue falls within the bottom 1% of eligible constituents.
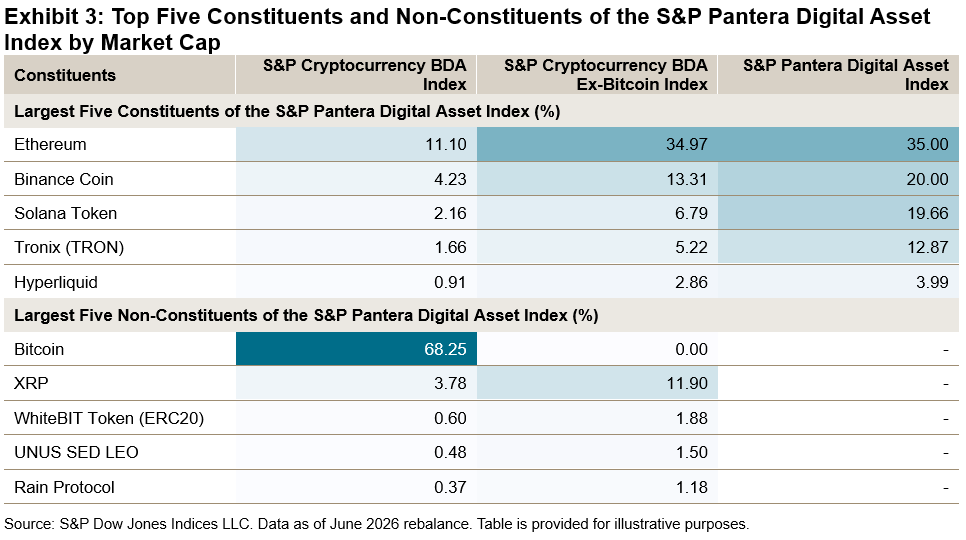
The revenue filter on the index means that, in practice, the type of protocols we typically see in the final selection are often smart contract platforms like Ethereum and Solana and decentralized finance applications like Hyperliquid. The largest five constituents are Ethereum, Binance Coin, Solana, TRON and Hyperliquid. The largest non-constituents when compared to the S&P Cryptocurrency BDA Index are Bitcoin and XRP, which are significant weights in standard market-cap-weighted indices.
Performance Characteristics of the S&P Pantera Digital Asset Index
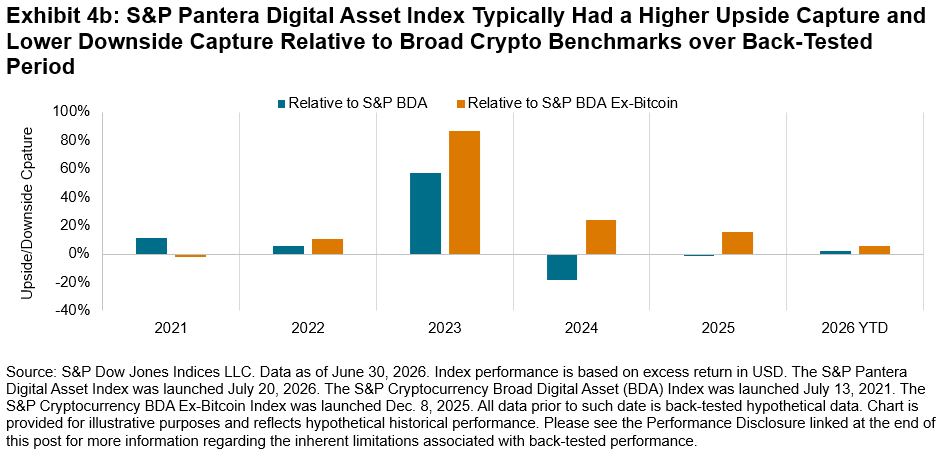
Despite not having Bitcoin in the index, based on back-tested analysis, the S&P Pantera Digital Asset Index has outperformed indices like the S&P Cryptocurrency BDA Index where Bitcoin accounts for approximately 70% of the index weight. Notably, over the three-year back-tested period ending June 30, 2026, the S&P Pantera Digital Asset Index had an annualized return of 25% versus 14% for the S&P Cryptocurrency BDA Index, an excess return of more than 10 percentage points, with a similar picture across the five-year period and since its first value date of June 18, 2021 (see Exhibit 4a and Exhibit 4b).

Conclusion
The S&P Pantera Digital Asset Index may serve a dual purpose: as a benchmark for actively managed crypto strategies and as a foundation for index-linked products. For different types of market participants, the S&P Pantera Digital Asset Index reflects the continued maturation of crypto benchmarking. By anchoring selection to observable protocol-level revenue, it offers a disciplined framework for evaluating digital assets through fundamentals. In a market often driven by narrative trading, the index’s emphasis on measurable activity offers a more data-driven way to understand where economic value may be forming in the digital asset ecosystem.
Learn more about the S&P Pantera Digital Asset Index in our brochure.
1 Watkins, Ryan, “The Productive Cryptoeconomy: A Thesis for Adoption,” Syncracy, Feb. 25, 2025.
3 Preston, Hamish, “Seasoning to Taste,” S&P Dow Jones Indices, March 3, 2026.
4 Weseley, Alex, “Crypto Revenue,” Artemis, Sept. 12, 2025.
The posts on this blog are opinions, not advice. Please read our Disclaimers.