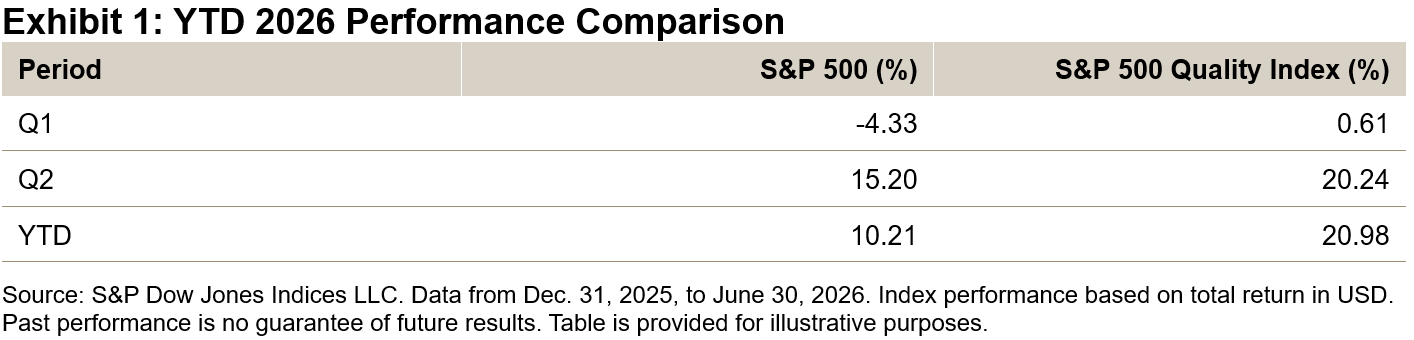

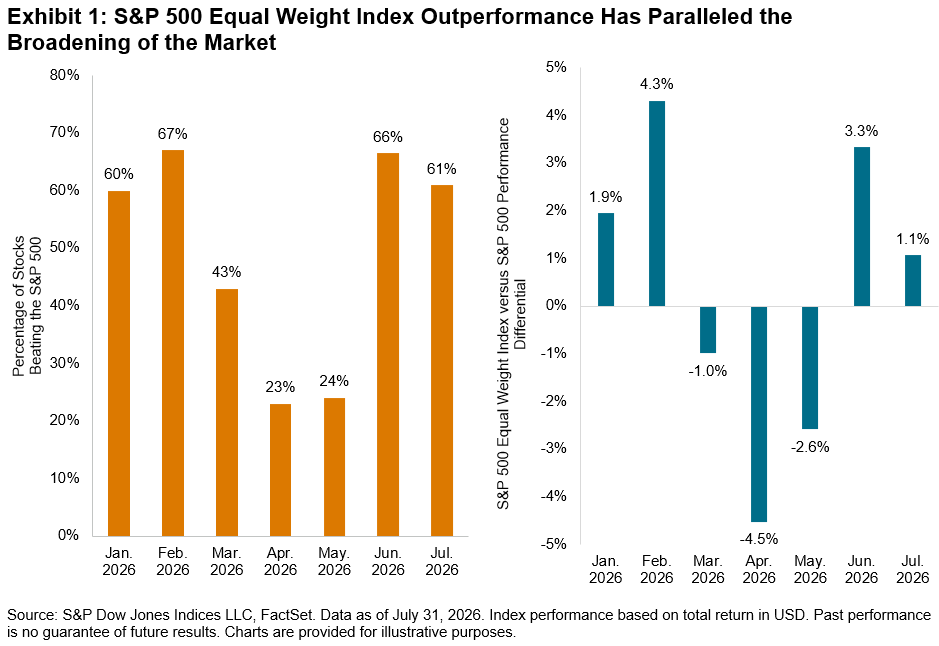
Despite recent declines upon renewed geopolitical concerns, the S&P 500® hit two all-time closing highs last week thanks to reduced expectations for a Fed rate hike after a soft jobs report and robust corporate earnings. One of the tailwinds of the market’s rally has been the broadening of performance beyond the mega cap hyperscalers,1 a much-needed panacea for those concerned about the dominance of the AI trade by a handful of companies. Exhibit 1 shows that more than 60% of stocks beat the S&P 500 in June and July.
We’ve previously discussed the movement of the rewards of investment in AI infrastructure toward the rapidly growing semiconductors industry.2 But the huge capital expenditure investments on AI appear to be benefiting the market at large. Aside from its slight underperformance month-to-date,3 the S&P 500 Equal Weight Index, which measures the performance of the average stock, outperformed the S&P 500 in June and July.
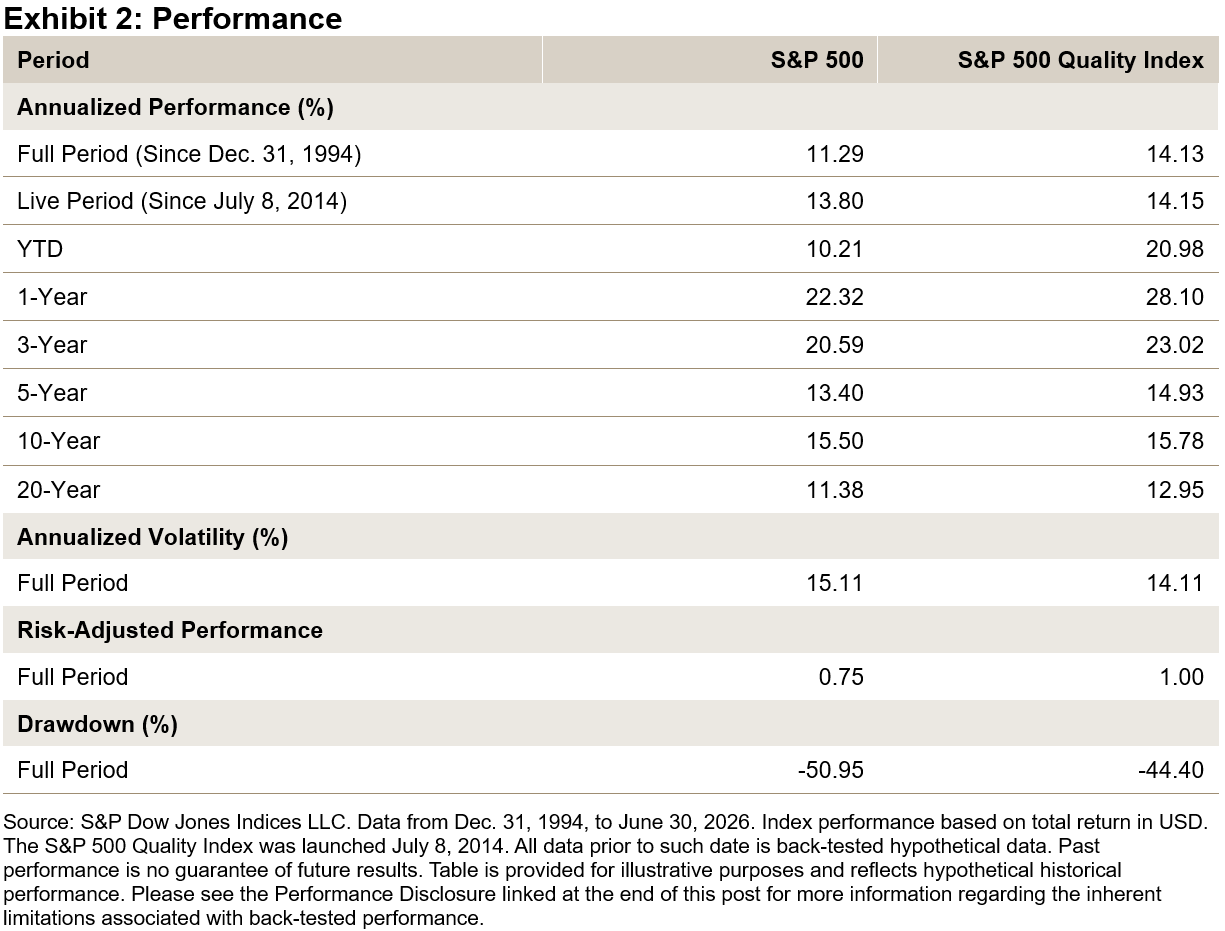
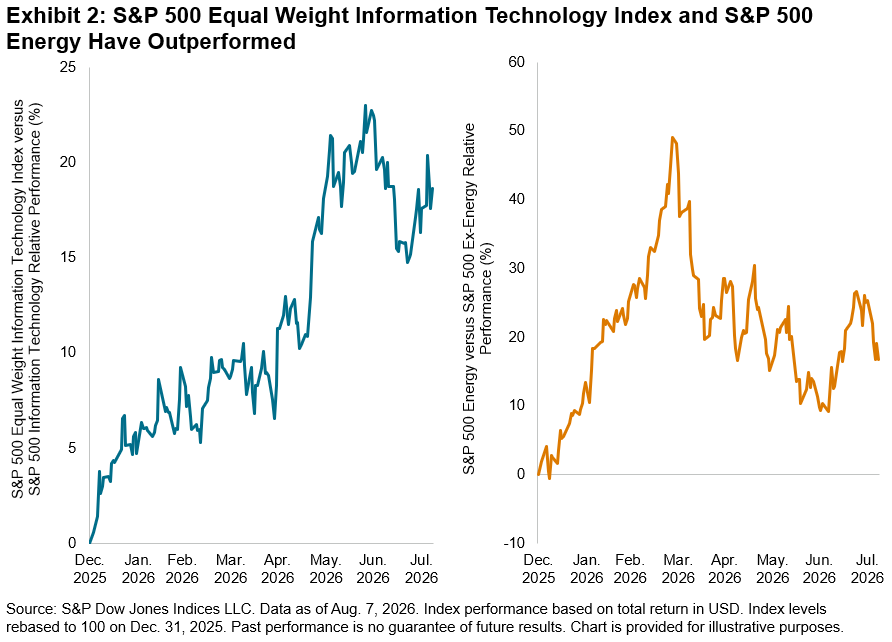
Stock- and sector-level dynamics can help explain the path to the S&P 500 Equal Weight Index’s outperformance. Market participation has expanded toward smaller companies in Information Technology, as illustrated in Exhibit 2, with the S&P 500 Equal Weight Information Technology Index outperforming its cap-weighted counterpart by 19% YTD.4 Another contributor has been the index’s overweight to the outperforming Energy sector, a key catalyst of which has been rising crude oil prices stemming from the ongoing conflict in the Middle East. The S&P 500 Energy outperformed the S&P 500 Ex-Energy by 17% YTD.
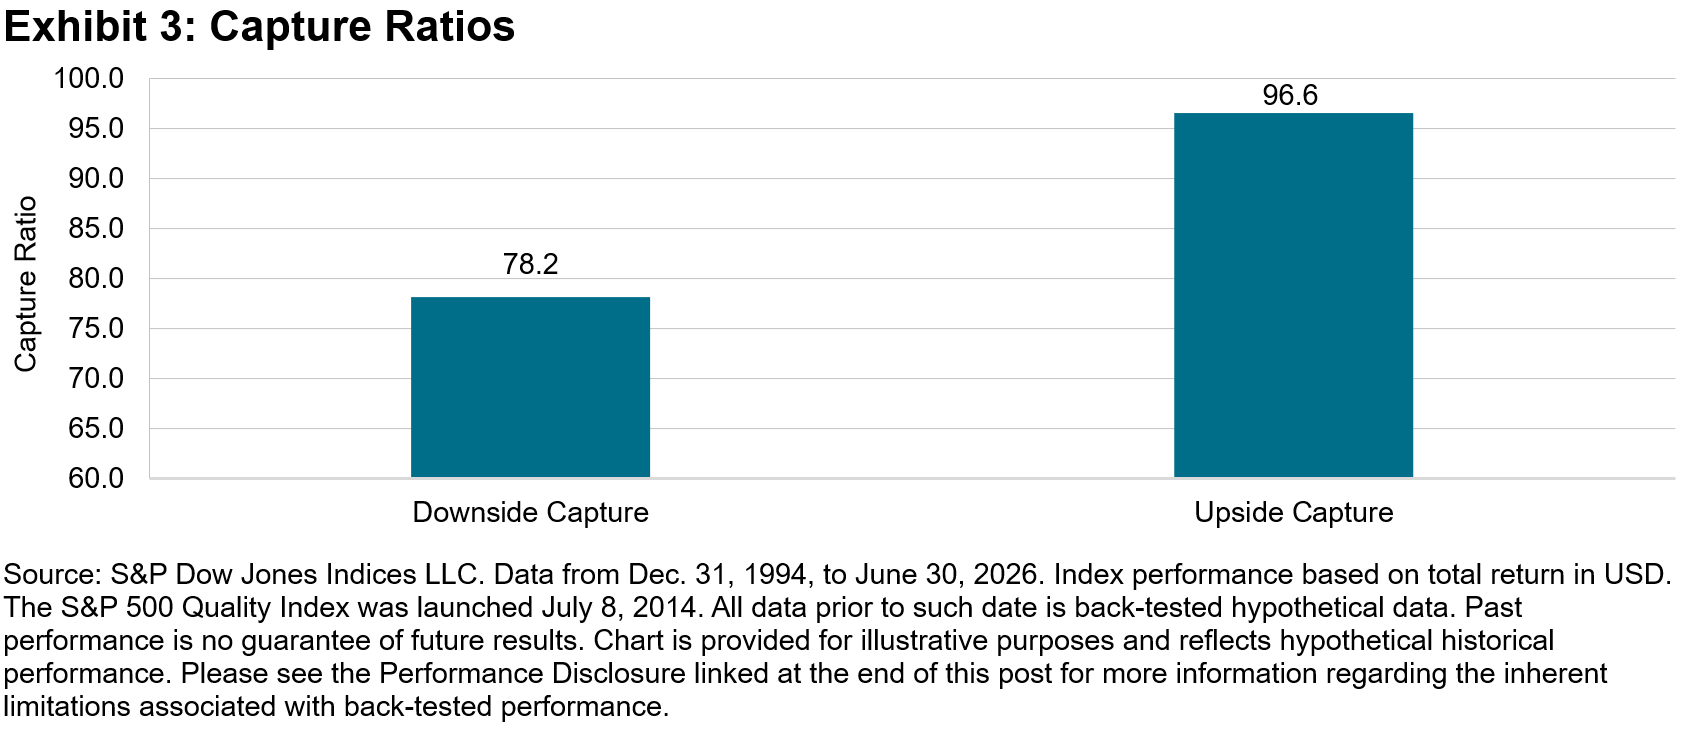
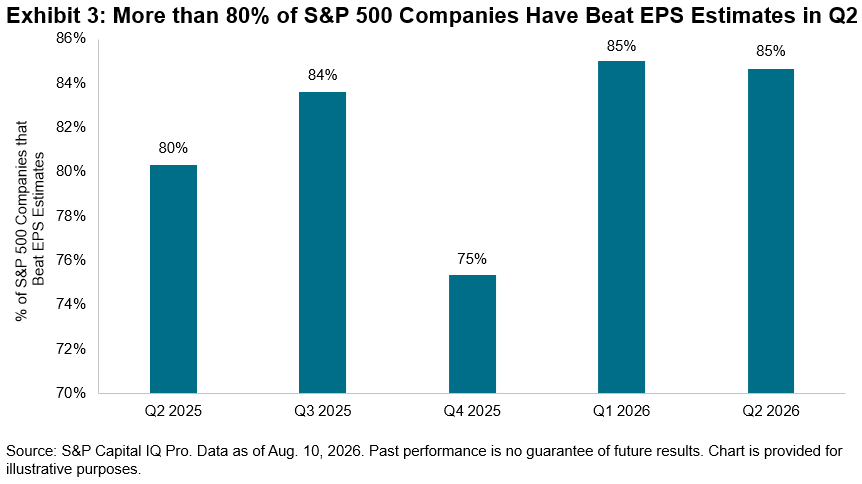
But the blockbuster earnings season in Q25 is evidence that the winners fueling the rise in market breadth are no longer housed solely in the Information Technology or Energy sectors. Of the S&P 500 companies that have reported so far, we observe in Exhibit 3 that roughly 85% have beat analysts’ estimates, consistent with Q1 and higher than the three quarters prior to that. Winners include companies situated in Health Care, Industrials and Real Estate.
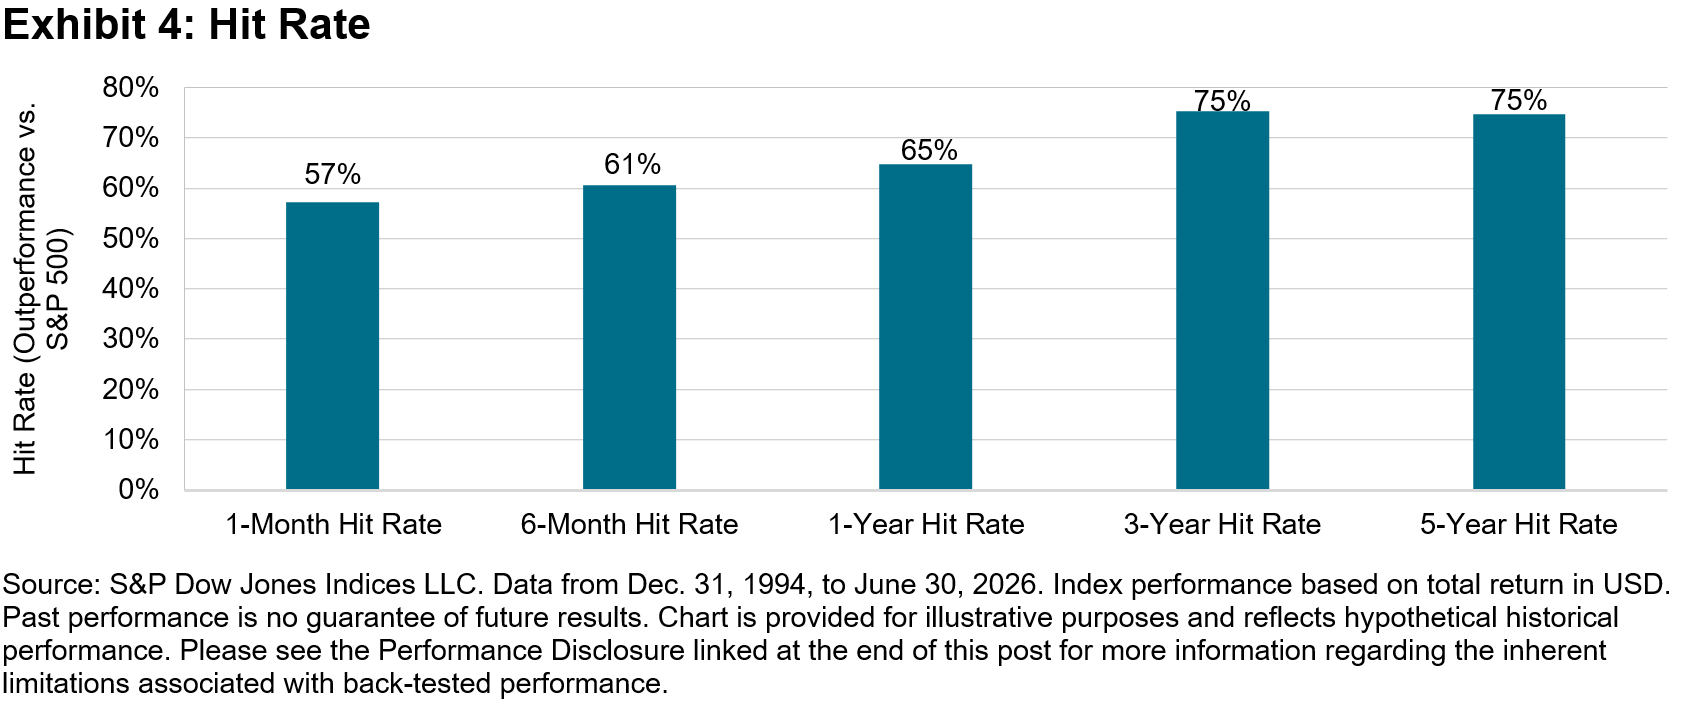
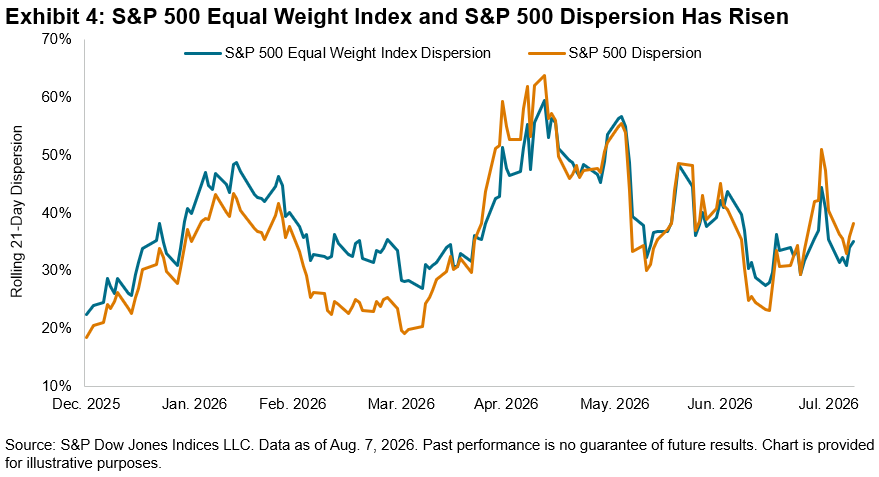
A natural outcome of rising market breadth has been the rise in dispersion, which measures how differently stocks are performing relative to each other. S&P 500 dispersion has reached historically high levels, and Exhibit 4 shows that S&P 500 Equal Weight Index dispersion has tracked closely with its cap-weighted peer. This is not surprising given the increased scrutiny faced by companies across the size spectrum, which is typical during an earnings season.
Given the broadening of the rally amid a backdrop of rising market dispersion and shifting performance among members of the AI value chain, understanding the stock and sectoral drivers behind the S&P 500 Equal Weight Index’s outperformance can be relevant as we approach the culmination of the Q2 earnings season.
1 Yue, Frances, “The number of stocks beating the S&P 500 is the highest in 4 years. Why that number should rise,” MarketWatch, Aug. 9, 2026.
2 See Ganti, Anu, “Regimes, Reversals and Risk,” S&P Dow Jones Indices LLC, July 9, 2026.
3 Data as of Aug. 7, 2026.
4 See S&P Equal Weight Sector Indices Dashboard, S&P Dow Jones Indices, July 2026.
5 Dinesh, Shradha, “Blockbuster Earnings Bolster Stocks’ Record Run,” The Wall Street Journal, Aug. 9, 2026.
The posts on this blog are opinions, not advice. Please read our Disclaimers.