
Get Indexology® Blog updates via email.

In This List

The S&P Developed Ex-North America Dividend Growers Index: Dividend Discipline, Defensive Characteristics and Outperformance

Indexing Autocalls

Broadening the Base

Factor Index Leadership in Australia: Has the Tide Turned?

Extending Market Representation: Public-Private Blends in Investment Solutions

The S&P Developed Ex-North America Dividend Growers Index: Dividend Discipline, Defensive Characteristics and Outperformance

Contributor Image
George Valantasis

Director, Factors and Dividends

S&P Dow Jones Indices

In November 2025, S&P DJI expanded its S&P Dividend Growers Index Series by launching the S&P Developed Ex-North America Dividend Growers Index. Like its counterparts, the index focuses on companies with a consistent history of dividend payments, while excluding those with the highest yields to help reduce the risk of yield traps.1 Over the back-tested period, this disciplined approach generated robust long-term outperformance and strong defensive characteristics relative to its universe, the S&P EPAC BMI.

In this blog, we will provide an overview of the index’s methodology—including its rigorous criteria—and showcase its outperformance and key defensive characteristics.

Methodology

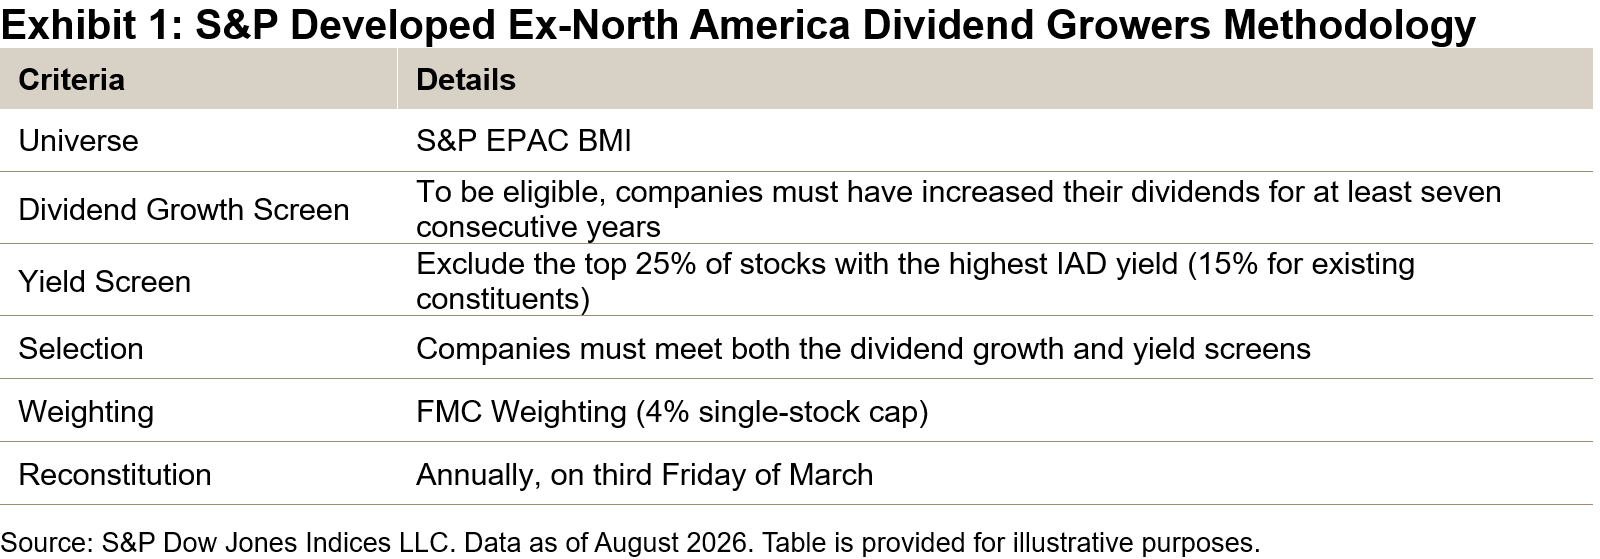
To qualify for inclusion, companies must have raised their dividends for at least seven consecutive years. Next, those ranked in the top 25% by indicated annual dividend (IAD) yield are excluded to help mitigate the risk of yield traps. Companies passing these screens are selected for the index and weighted by float-adjusted market capitalization (FMC).

The dividend growth and yield screens are the defining features of the S&P Dividend Growers Index Series. By working in tandem, these filters aim to enhance the overall quality of the index and drove its strong performance and defensive characteristics over the back-tested period, which will be explored in the following sections.
Performance

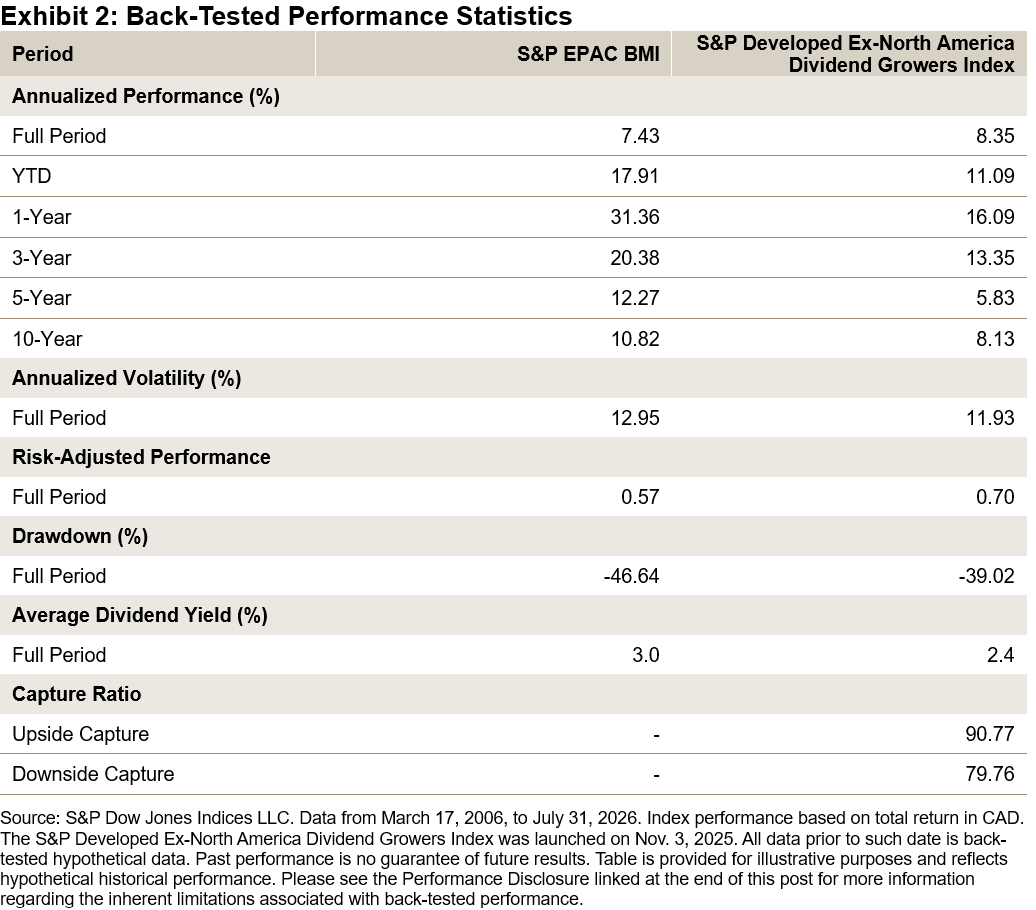
Over the 20 years of back-tested data since its inception, the S&P Developed Ex-North America Dividend Growers Index outpaced the S&P EPAC BMI by approximately 92 bps on an annualized basis. Notably, it delivered this outperformance while demonstrating defensive characteristics, including lower volatility (11.93% versus 12.95%), a smaller maximum drawdown (39.0% versus 46.6%) and more favorable capture ratios (90.77 upside and 79.76 downside) relative to the S&P EPAC BMI.

Beyond these standard measures of defensive characteristics, the next section delves deeper into how the index behaved during past drawdown events and across different macroeconomic environments.
Defensive Characteristics

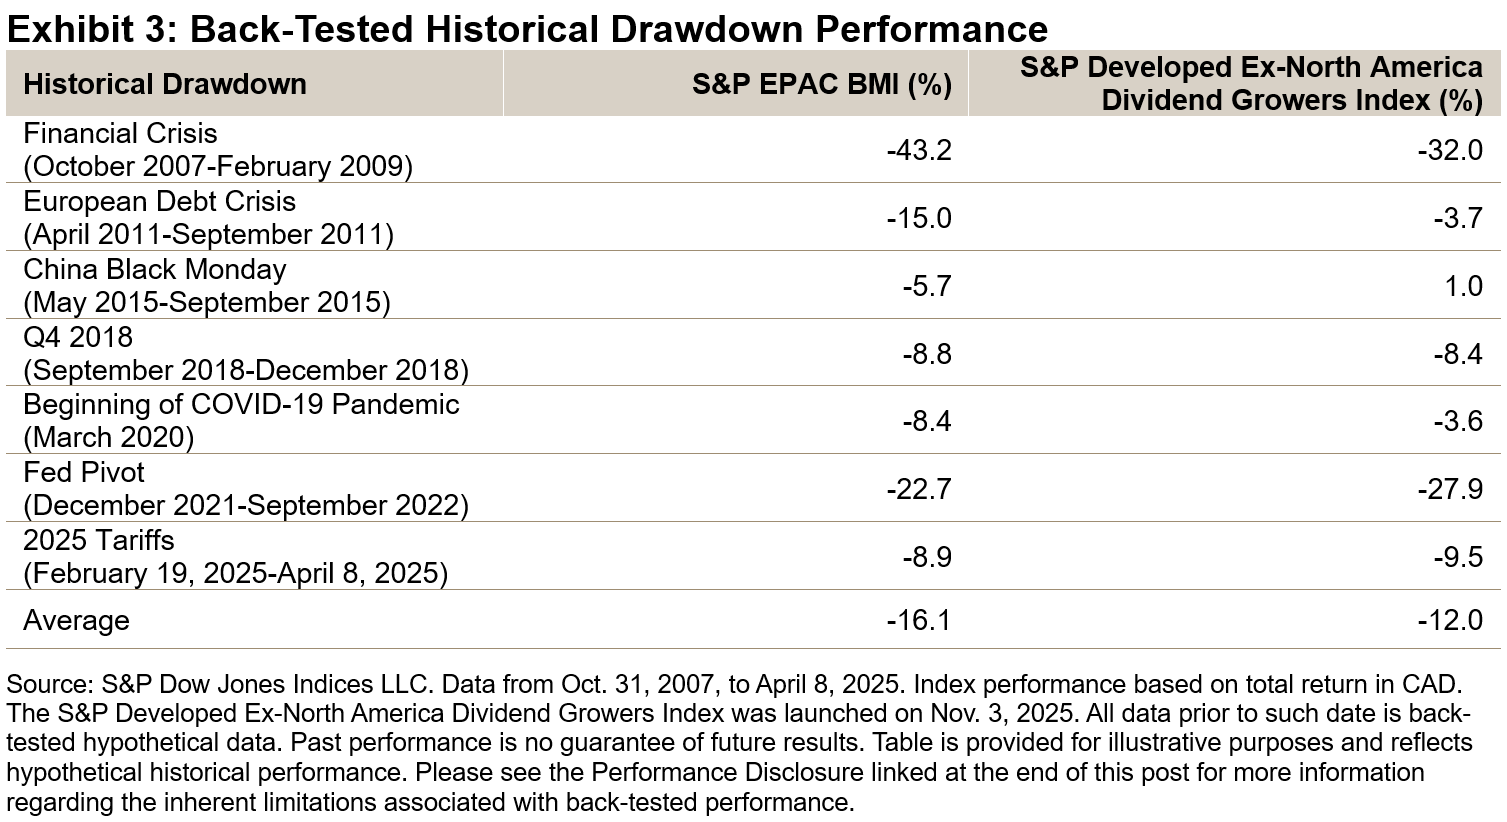
Over the back-tested period, the S&P Developed Ex-North America Dividend Growers Index outperformed the S&P EPAC BMI in five of the last seven major drawdown periods. During these drawdowns, it demonstrated downside protection, with an average decline of 12.0% compared with 16.1% for the S&P EPAC BMI.
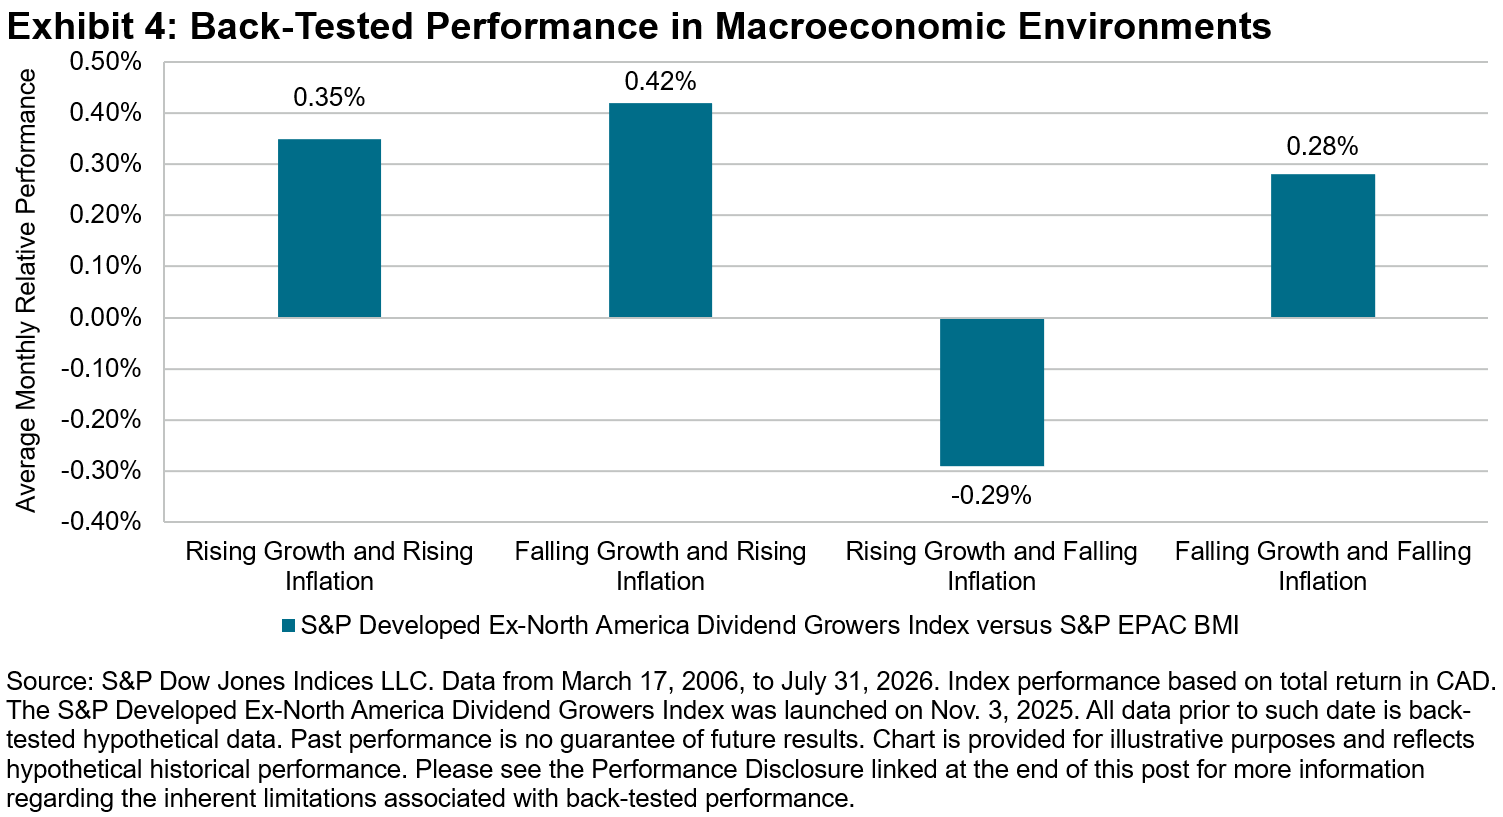
Defensive characteristics are further highlighted in Exhibit 4, which shows the index’s outperformance or underperformance across four macroeconomic environments defined by rising or falling inflation and growth. The index’s defensive profile is underscored by its outperformance in three of the four regimes, with its strongest results in the “risk-off” stagflationary environment (falling growth, rising inflation), while it lagged only in the “risk-on” regime characterized by rising growth and falling inflation.
Consistent Outperformance

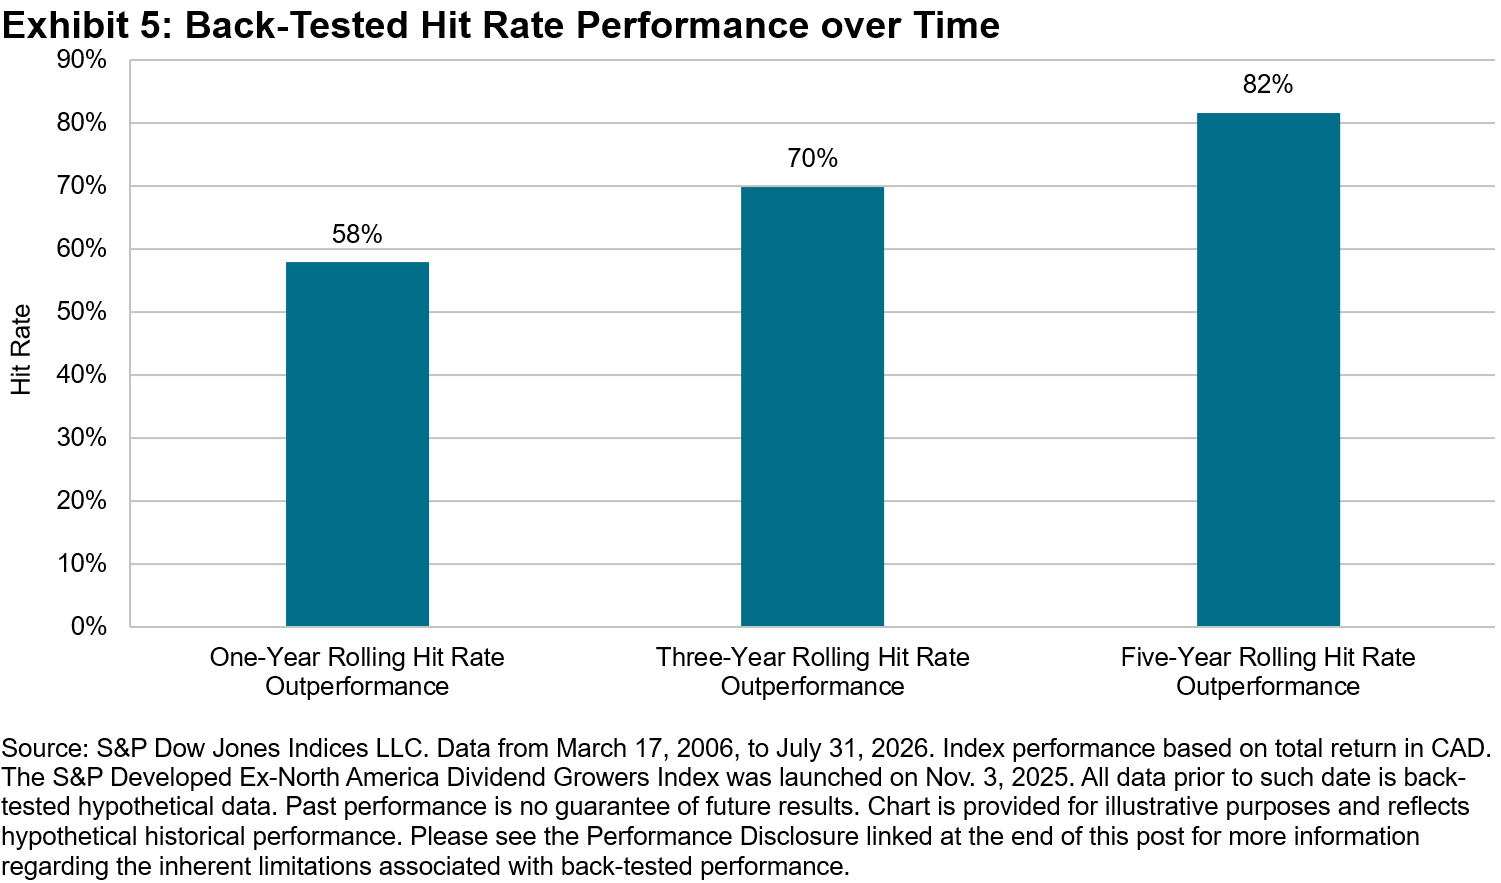
A key highlight from the back-tested period is the consistent outperformance of the S&P Developed Ex-North America Dividend Growers Index, which becomes more pronounced over longer investment horizons. The index outperformed the S&P EPAC BMI in 58% of one-year rolling periods, 70% of three-year rolling periods and a notable 82% of five-year rolling periods.
Conclusion

S&P DJI is pleased to expand the S&P Dividend Growers Index Series with the S&P Developed Ex-North America Dividend Growers Index. Like others in the broader series, the index’s rigorous methodology has led to strong long-term performance and defensive characteristics throughout the back-tested period.


1For more information about yield traps, please see: https://www.vanguard.com.au/personal/learn/smart-investing/investing-strategy/avoid-dividend-yield-traps

The posts on this blog are opinions, not advice. Please read our Disclaimers.
Indexing Autocalls

Contributor Image
Kelsey Stokes

Head of Financial Institutions Sales, Americas

S&P Dow Jones Indices

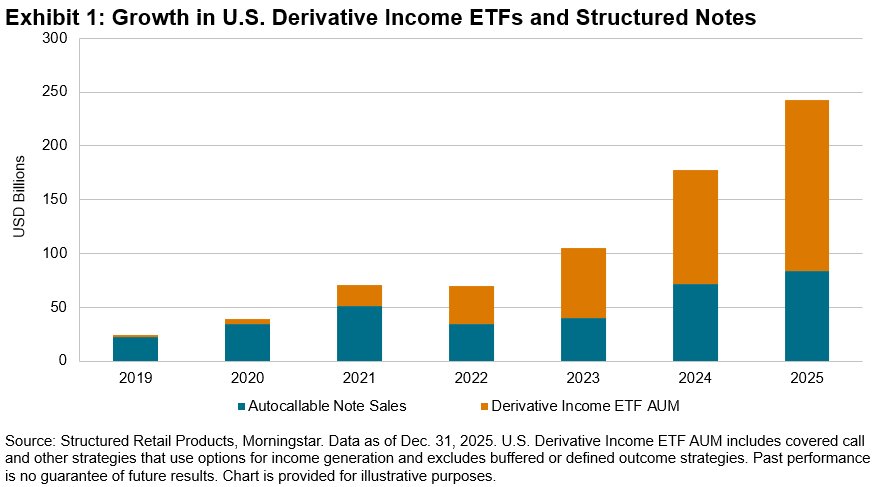
Income-oriented indexing has entered a new phase. What began with relatively straightforward option-writing indices has evolved into a broader toolkit of rules-based strategies designed to reflect more targeted outcomes. This evolution reflects a shift in investor demand beyond pure beta exposure and toward outcome-oriented solutions. In recent years, systematic derivative income strategies have grown meaningfully across both ETFs and structured products.

With the launch of the first autocallable ETF in 2025, sophisticated payoff structures that were once only accessible to a limited set of market participants via structured products are now available to the broader market. Indexing has helped make this innovation possible. Today, a single rules-based index can theoretically replicate the payoff structure of an autocallable—also referred to as an autocall—by combining multiple forms of optionality into a rules-based methodology incorporating features such as hypothetical contingent income, observation dates, barriers and potential early redemption. Recall that an index is not an investment product; one cannot invest directly in an index but rather an investment product based on an index.

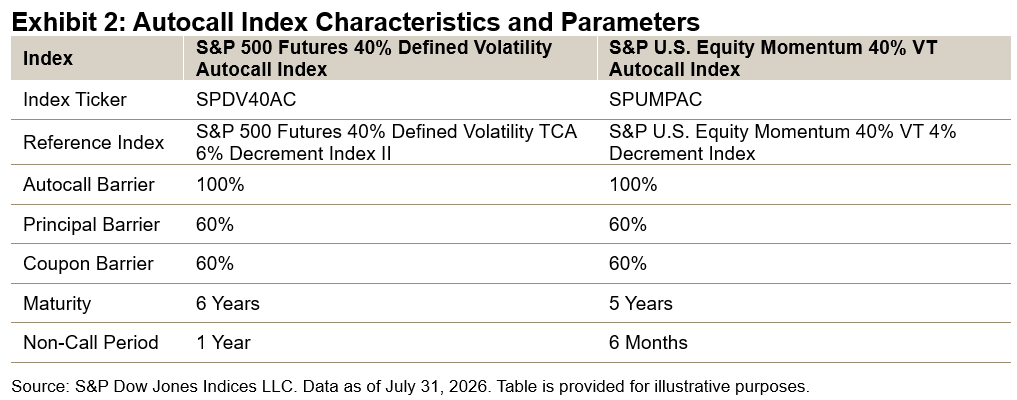
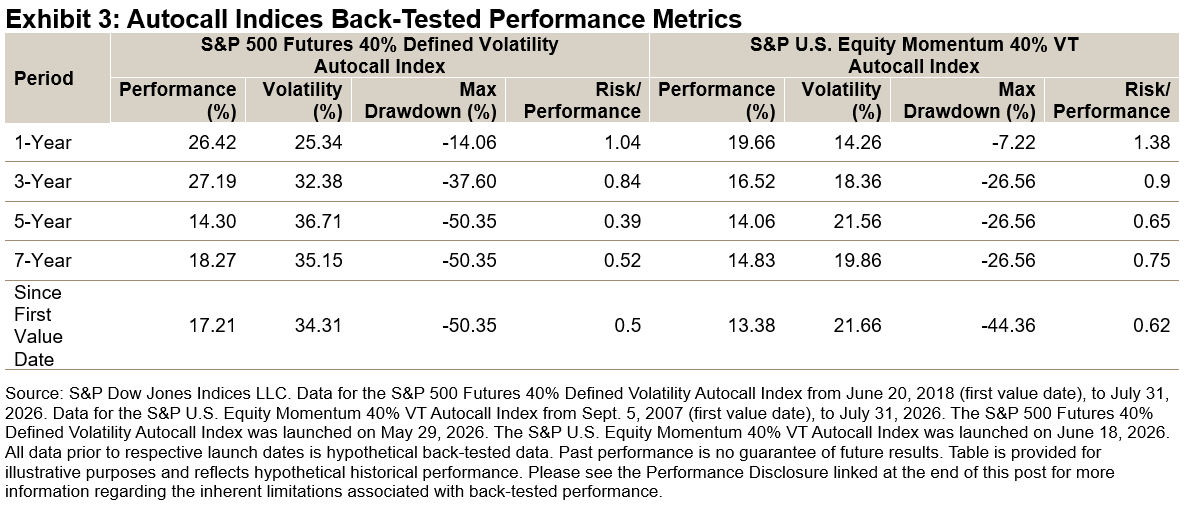
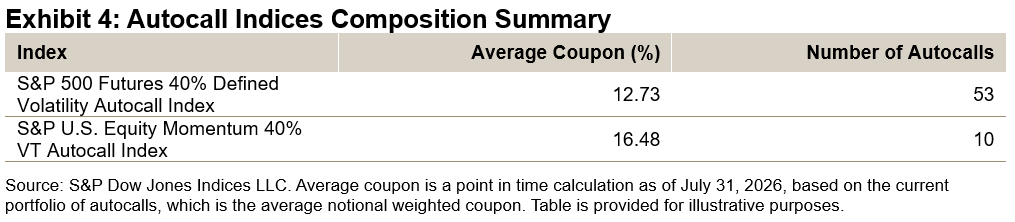
S&P Dow Jones Indices recently launched two autocall indices: the S&P 500 Futures 40% Defined Volatility Autocall Index and the S&P U.S. Equity Momentum 40% VT Autocall Index. Each index takes a different approach to replicating an autocall payoff structure reflecting potential income generation. For more information, please see the S&P 500 Futures 40% Defined Volatility Autocall Index Methodology and the S&P U.S. Equity Momentum 40% VT 4% Decrement Autocall Index Methodology.

To better understand these indices, it’s necessary to understand how autocalls work. Autocall notes link coupon payments to the performance of a reference asset—in this case an underlying index. If the reference index remains above a predetermined level, the autocall pays a coupon. If the reference index experiences a  certain decline, coupon payments may cease or principal may be at risk. In this way, autocall structures reflect tradeoffs; market participants may enjoy income derived from equity markets in exchange for some downside risk.

The S&P 500 Futures 40% Defined Volatility Autocall Index features a “dual yield” structure, with the potential for simulated income generation both from coupons and 50% of the upside participation of the reference index’s performance. This additional upside participation aims to mitigate the opportunity cost that an autocall structure may face during equity market rallies.

The S&P U.S. Equity Momentum 40% VT Autocall Index features a memory coupon that lasts for 12 months. For an eligible coupon as of a point in time, the memory coupon will also reflect any missed coupons from the past 12 months. The index also features a “pruning” mechanism that serves to systematically replace underperforming autocalls.

Both autocall indices employ a laddered structure whereby new autocalls are initiated on a staggered basis to help mitigate the impact of entry point risk and tail risk.

As investor demand for defined outcome strategies continues to evolve, indices may play an increasingly important role as a tool in making sophisticated payoff structures accessible via linked investment products to a broader set of market participants.

The posts on this blog are opinions, not advice. Please read our Disclaimers.
Broadening the Base

Contributor Image
Anu Ganti

Head of U.S. Index Investment Strategy

S&P Dow Jones Indices

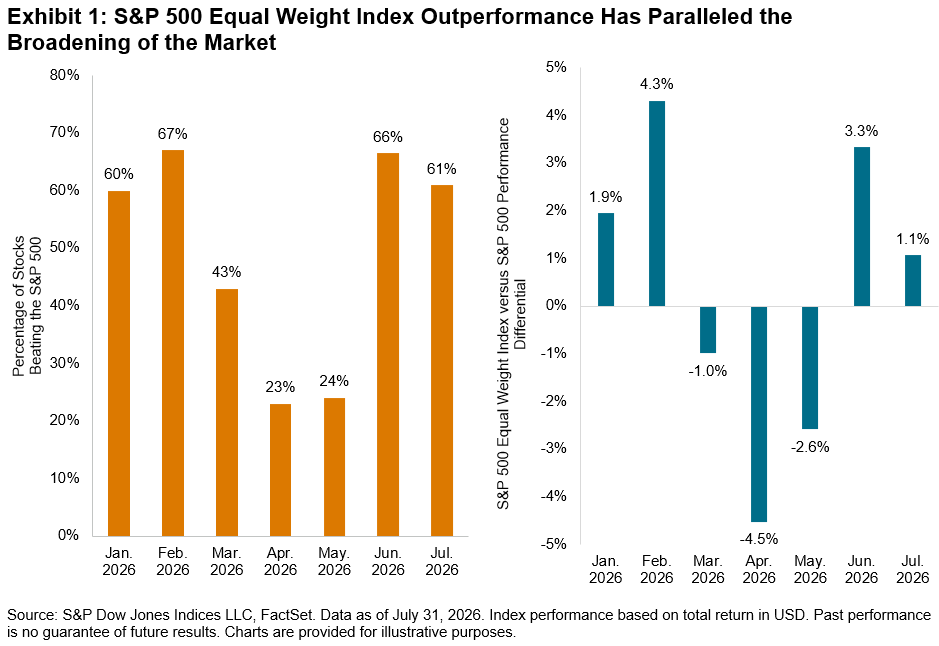
Despite recent declines upon renewed geopolitical concerns, the S&P 500® hit two all-time closing highs last week thanks to reduced expectations for a Fed rate hike after a soft jobs report and robust corporate earnings. One of the tailwinds of the market’s rally has been the broadening of performance beyond the mega cap hyperscalers,1 a much-needed panacea for those concerned about the dominance of the AI trade by a handful of companies. Exhibit 1 shows that more than 60% of stocks beat the S&P 500 in June and July.

We’ve previously discussed the movement of the rewards of investment in AI infrastructure toward the rapidly growing semiconductors industry.2 But the huge capital expenditure investments on AI appear to be benefiting the market at large. Aside from its slight underperformance month-to-date,3 the S&P 500 Equal Weight Index, which measures , outperformed the S&P 500 in June and July.

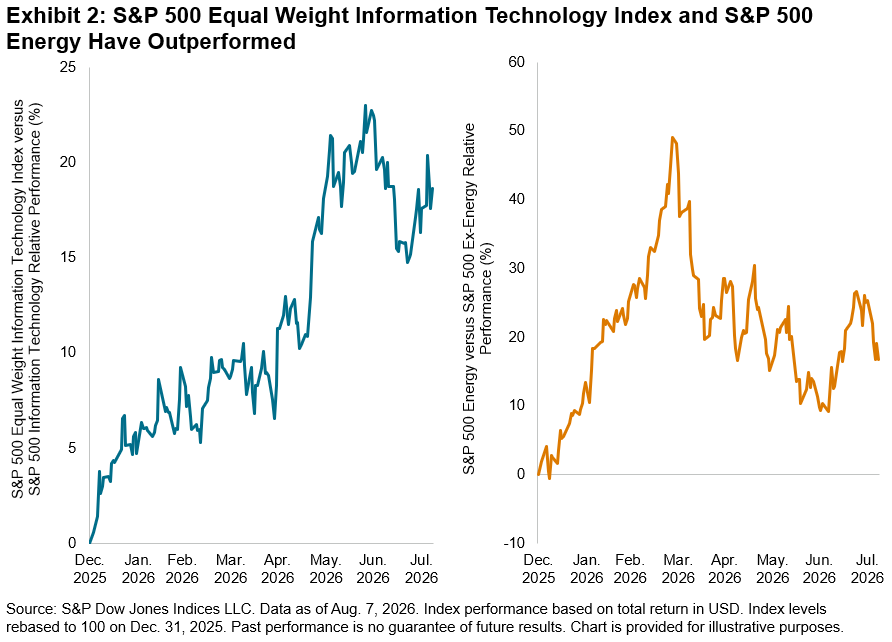
Stock- and sector-level dynamics can help explain the path to the S&P 500 Equal Weight Index’s outperformance. Market participation has expanded toward smaller companies in Information Technology, as illustrated in Exhibit 2, with the S&P 500 Equal Weight Information Technology Index outperforming its cap-weighted counterpart by 19% YTD.4 Another contributor has been the index’s overweight to the outperforming Energy sector, a key catalyst of which has been rising crude oil prices stemming from the ongoing conflict in the Middle East. The S&P 500 Energy outperformed the S&P 500 Ex-Energy by 17% YTD.

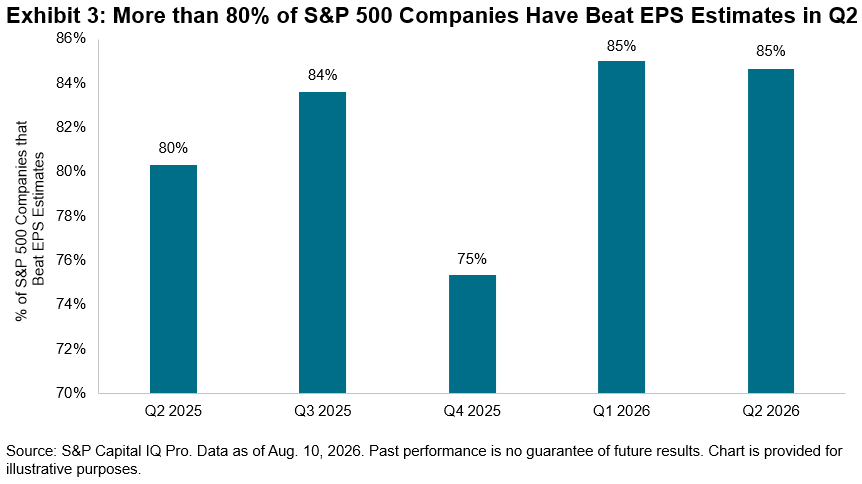
But the blockbuster earnings season in Q25 is evidence that the winners fueling the rise in market breadth are no longer housed solely in the Information Technology or Energy sectors. Of the S&P 500 companies that have reported so far, we observe in Exhibit 3 that roughly 85% have beat analysts’ estimates, consistent with Q1 and higher than the three quarters prior to that. Winners include companies situated in Health Care, Industrials and Real Estate.

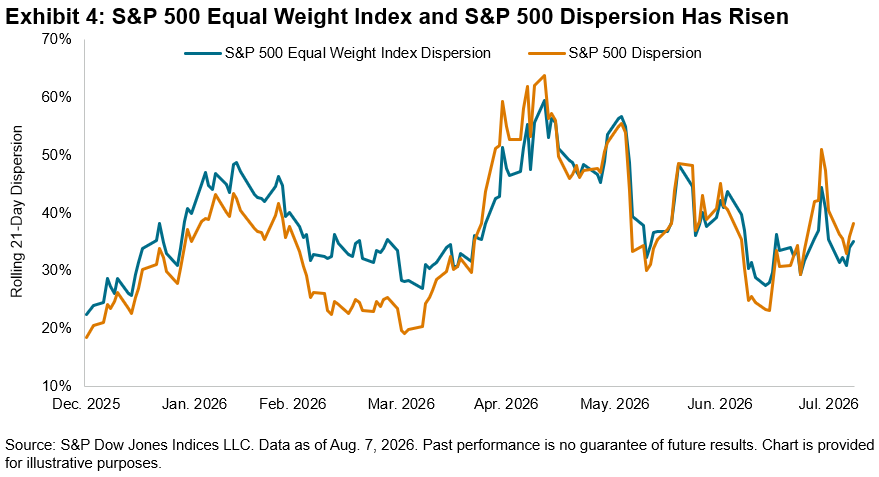
A natural outcome of rising market breadth has been the rise in dispersion, which measures how differently stocks are performing relative to each other. S&P 500 dispersion has reached historically high levels, and Exhibit 4 shows that S&P 500 Equal Weight Index dispersion has tracked closely with its cap-weighted peer. This is not surprising given the increased scrutiny faced by companies across the size spectrum, which is typical during an earnings season.

Given the broadening of the rally amid a backdrop of rising market dispersion and shifting performance among members of the AI value chain, understanding the stock and sectoral drivers behind the S&P 500 Equal Weight Index’s outperformance can be relevant as we approach the culmination of the Q2 earnings season.


1 Yue, Frances, “The number of stocks beating the S&P 500 is the highest in 4 years. Why that number should rise,” MarketWatch, Aug. 9, 2026.

2 See Ganti, Anu, “Regimes, Reversals and Risk,” S&P Dow Jones Indices LLC, July 9, 2026.

3 Data as of Aug. 7, 2026.

4 See S&P Equal Weight Sector Indices Dashboard, S&P Dow Jones Indices, July 2026.

5 Dinesh, Shradha, “Blockbuster Earnings Bolster Stocks’ Record Run,” The Wall Street Journal, Aug. 9, 2026.

The posts on this blog are opinions, not advice. Please read our Disclaimers.
Factor Index Leadership in Australia: Has the Tide Turned?

Contributor Image
Jason Ye

Senior Director, Factors and Dividends

S&P Dow Jones Indices

Last year, we published a paper reviewing the long-term performance of factor indices in the Australian market. One of the key observations from that paper was that, over the long term, quality and momentum had historically been among the strongest-performing single-factor indices. More recently, however, both quality and momentum have faced performance challenges, while enhanced value and high dividend strategies have outperformed the broad market. This blog revisits the recent performance of Australian factor indices and examines some of the drivers behind these shifts.

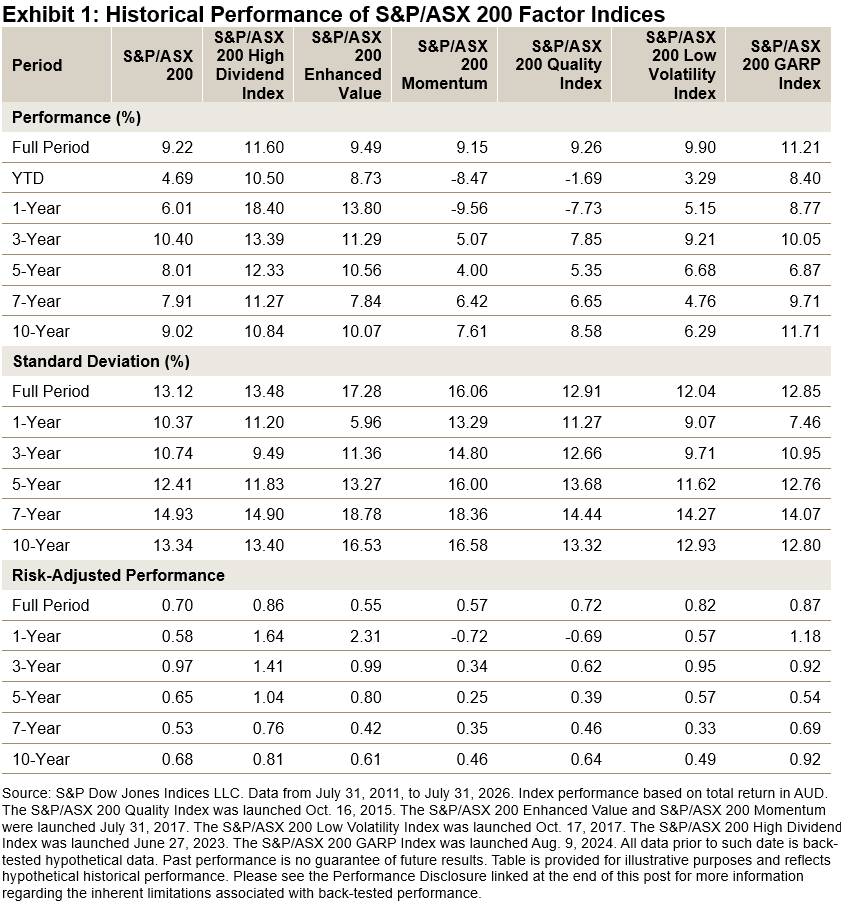
Exhibit 1 compares the recent performance of headline S&P/ASX 200 Factor Indices: the S&P/ASX 200 High Dividend Index, S&P/ASX 200 Enhanced Value, S&P/ASX 200 Momentum, S&P/ASX 200 Quality Index and S&P/ASX 200 Low Volatility Index. The full period shown spans the 15-year period from August 2011 to July 2026 and includes back-tested data. Over this horizon, the best-performing single factor was high dividend, followed by low volatility and enhanced value. Quality and momentum ranked lower within the S&P/ASX 200 factor universe, highlighting how different observation periods can lead to different conclusions about factor performance. Low volatility’s long-term performance was largely supported by its strong run from 2011 to 2015, when it outperformed the S&P/ASX 200 for five consecutive years. By contrast, enhanced value and high dividend indices have posted strong relative performance over the past five years. In terms of risk, the enhanced value and momentum factors exhibited meaningfully higher volatility than the benchmark and most other factor indices, while the volatility of the remaining factor indices was generally more in line with the S&P/ASX 200 over the long term.

Exhibit 1 also includes the S&P/ASX 200 GARP Index, a multi-factor index that integrates growth, quality and valuation considerations. The combination of these signals into one index led the S&P/ASX 200 GARP Index to post strong historical performance with lower volatility, resulting in the strongest risk-adjusted performance profile over the 15-year period.1

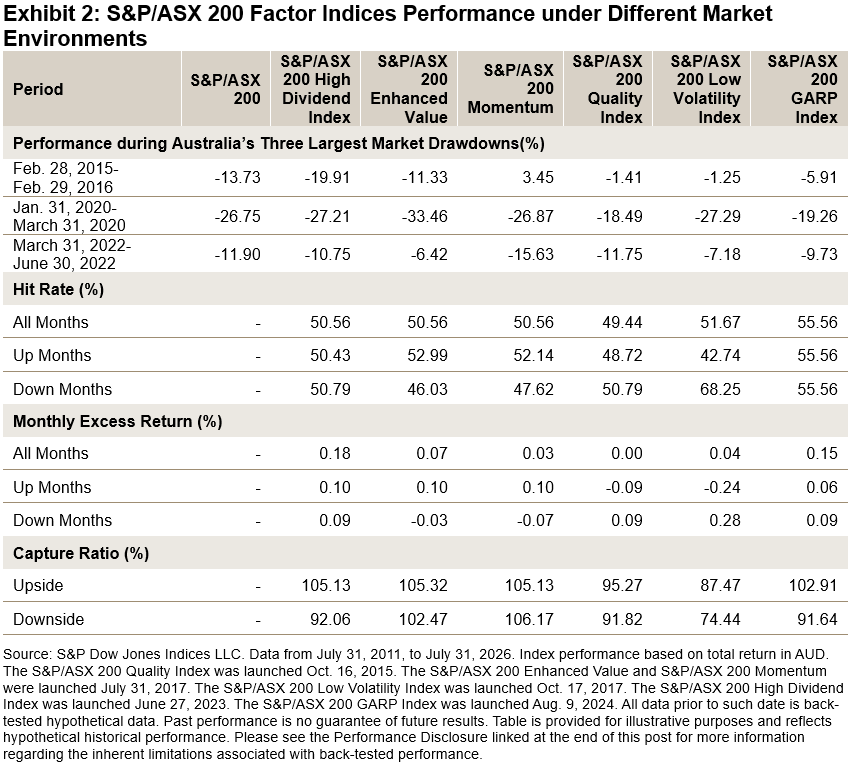
Even when two factor indices both generated historical outperformance, the sources and timing of that outperformance could differ meaningfully. Exhibit 2 shows factor index performance during three major drawdown periods over the past 15 years, as well as the average performance during months when the S&P/ASX 200 posted gains (up months) or losses (down months). The results suggest that quality and low volatility tended to behave more defensively, with a greater tendency to outperform when the S&P/ASX 200 declined. By contrast, enhanced value and momentum were generally more pro-cyclical, with outperformance more likely during positive market months. Due to their index designs, high dividend and GARP showed a more balanced pattern across market environments, generating positive relative performance on average in both up and down markets.

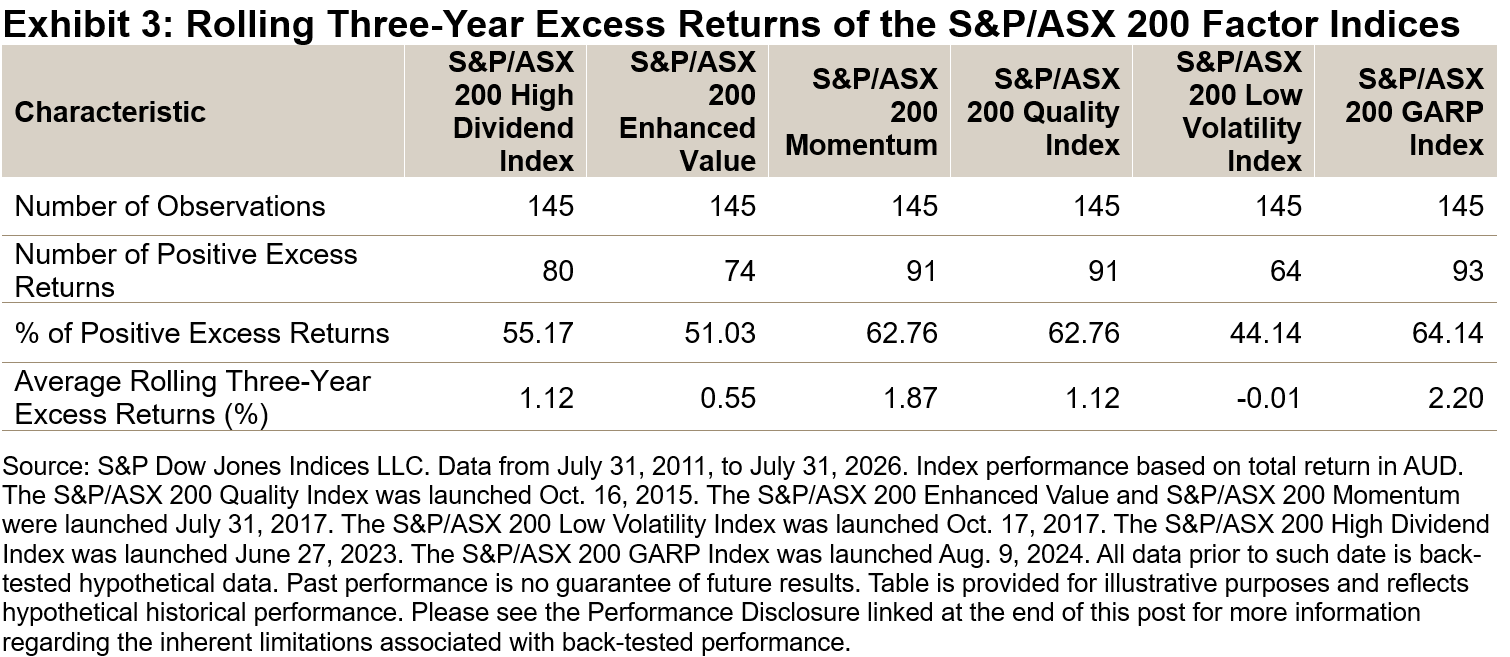
Although high dividend, low volatility and GARP were the three strongest performers over the full 15-year period, performance stability provides another important perspective. Measured by the proportion of rolling three-year periods in which each index outperformed the S&P/ASX 200 (see Exhibit 3), momentum, quality and GARP showed a higher likelihood of outperformance. Each outperformed the benchmark in more than 60% of rolling three-year windows, underscoring the importance of looking beyond cumulative performance alone when evaluating factor strategies.

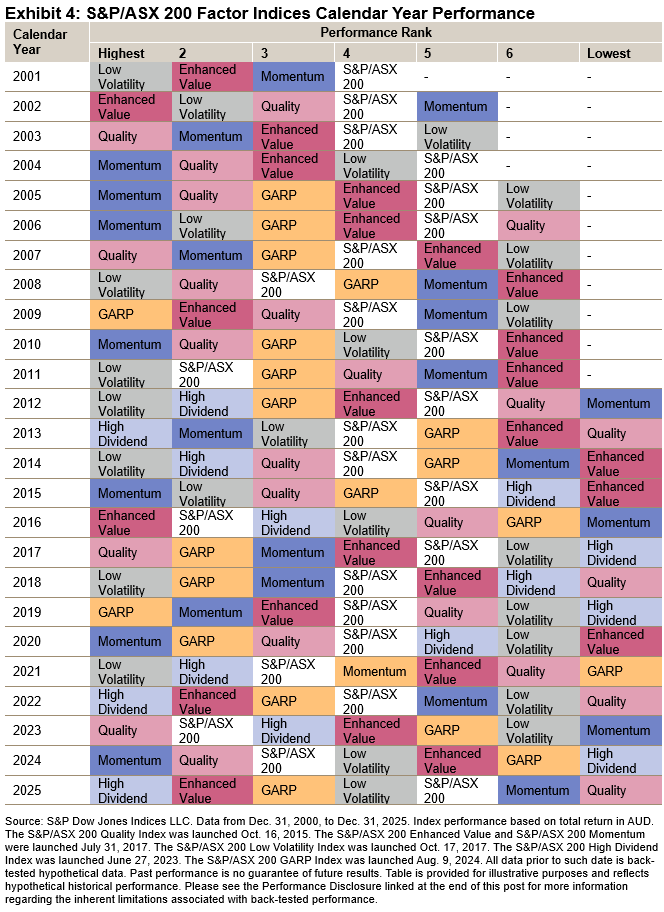
The rolling three-year results also reinforce the cyclical nature of factor performance. Exhibit 4 presents a heat map of calendar-year performance across the factor indices. As noted earlier, low volatility enjoyed a strong five-year period between 2011 and 2015, but its relative performance weakened in the subsequent five years, with 2018 as a notable exception. Quality and momentum had a strong run in 2024, while enhanced value and high dividend rebounded in 2025. The historical calendar-year performance pattern illustrates how factor performance has varied over time in the Australian market. This is another reason why a multi-factors approach, such as GARP, has helped mitigate the cyclicality associated with individual factors.

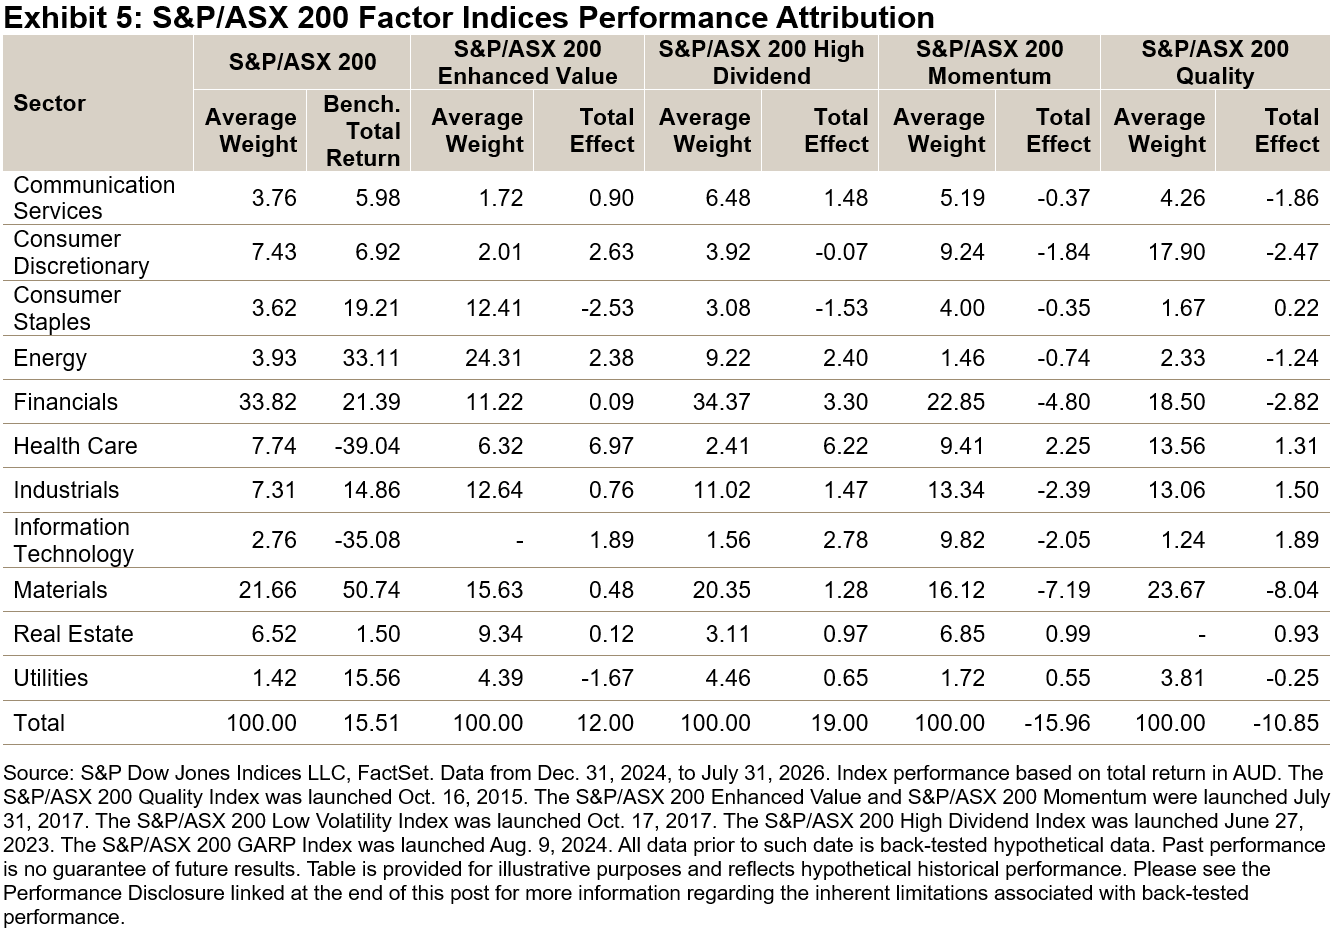
Lastly, what has driven the recent outperformance of the enhanced value and high dividend factors, and what has weighed on quality and momentum? The attribution analysis points to a mix of an index’s sector profile and stock selection effects. At a high level, Materials, Energy and Financials performed relatively well, while Information Technology and Health Care lagged during the period observed. This sector divergence generally benefited the enhanced value and high dividend factor indices and weighed on quality and momentum. At the stock level, BHP was a strong contributor and James Hardie Industries was a main drag within Materials, while Pro Medicus and REA Group also faced more challenging periods, creating headwinds for the quality factor index.

In summary, the recent performance of the S&P/ASX 200 Factor Indices highlights both the persistence and cyclicality of factor indices in Australia. While high dividend and enhanced value have benefited from recent market leadership in sectors such as Materials, Energy and Financials, quality and momentum have faced headwinds from both sector makeup and stock-specific challenges. Over longer horizons, however, factor leadership has rotated meaningfully, reinforcing the importance of evaluating performance across different market environments. Meanwhile, the GARP multi-factor approach offered a more balanced performance profile compared with the single-factor indices.

1 For more information about the S&P/ASX 200 GARP Index, please see our paper “Exploring the S&P/ASX 200 GARP Index.”

The posts on this blog are opinions, not advice. Please read our Disclaimers.
Extending Market Representation: Public-Private Blends in Investment Solutions

Contributor Image
Wanying Wu

Senior Analyst, Private Markets Indices

S&P Dow Jones Indices

A Changing Composition of Equity Markets

Public equity indices have traditionally aimed to represent the broad investable ecosystem. They remain a core building block for investors seeking equity market insight, and benchmarks including the S&P 500® continue to play this role effectively. However, structural changes in capital markets suggest that public equities may not always fully reflect the entire spectrum of where value is being created.

Private markets are playing an increasingly important role in the global economy. Companies are staying private for longer, often growing to a significant scale before an initial public offering (IPO). As a result, a meaningful share of value creation can occur outside of public markets.

Fewer Public Companies, More Private Capital

In 2000, there were approximately 12,700 publicly listed companies across the U.S. and Europe. By 2024, that number had declined to around 8,600, representing a reduction of roughly 32% (see Exhibit 1). The number of private equity-backed companies increased from about 1,400 in 2000 to more than 10,000 by 2020—a sevenfold increase.1 These figures also highlight the extent to which corporate activity has shifted toward private ownership structures.

IPO activity is lower than in the 1990s, and firms have tended to go public at a more mature stage. As a result, an increasing share of value creation is occurring before companies reach public markets, meaning many investors are accessing these businesses only after a substantial portion of their growth has already taken place.

Large and Influential Companies outside Public Markets

The presence of large, systemically important private companies further illustrates this shift. Firms such as OpenAI, Anthropic and Databricks have achieved significant scale and influence while remaining privately held. Their absence from public benchmarks highlights a potential gap between index representation and the evolving structure of the economy.

Development of Public-Private Blending

These observations have contributed to growing interest in combining public and private exposures. In equities, integrating public and private companies within a single framework can provide a more complete view of growth across different stages of the company lifecycle.

A similar dynamic can be observed in credit markets, where public-private blended strategies are emerging. In this context, the rationale is less about reflecting growth and more about accessing a broader opportunity set, including the higher yield potential historically associated with private credit. Recent developments, such as blended exchange-traded credit funds, reflect this broader convergence between public and private market segments.

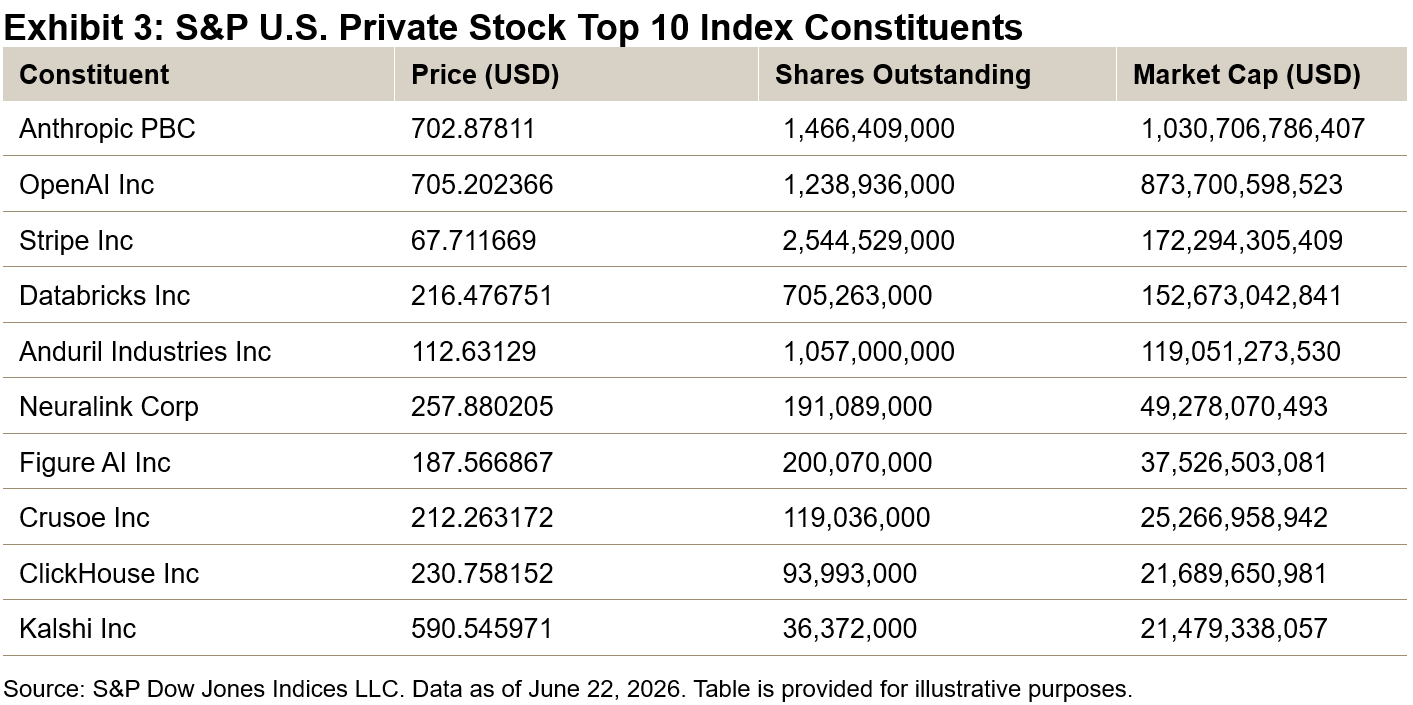
One possible extension is a blended equity composition incorporating both public and private companies. A structure consisting of a broad public benchmark blended with the S&P U.S. Private Stock Top 10 Index—which is part of the broader S&P Private Stock Index Series and measures the performance of the 10 largest private companies in the U.S. (see Exhibit 3)—may offer a practical framework for a strategy. The S&P Private Stock Index Series also includes benchmarks covering different regions and varying cohorts of leading private companies, enabling scalable public-private combinations across geographies and market segments.

Liquidity rules for funds vary by region, but most frameworks limit exposure to illiquid assets, typically keeping allocations in the low double-digit range. This means private assets can be included in traditional mutual funds or ETFs, but usually only at modest levels in line with local regulatory constraints.

At the same time, newer fund structures designed for less liquid investments—such as evergreen or semi-liquid vehicles—may have greater flexibility, allowing for higher allocations to private markets than traditional daily dealing funds.

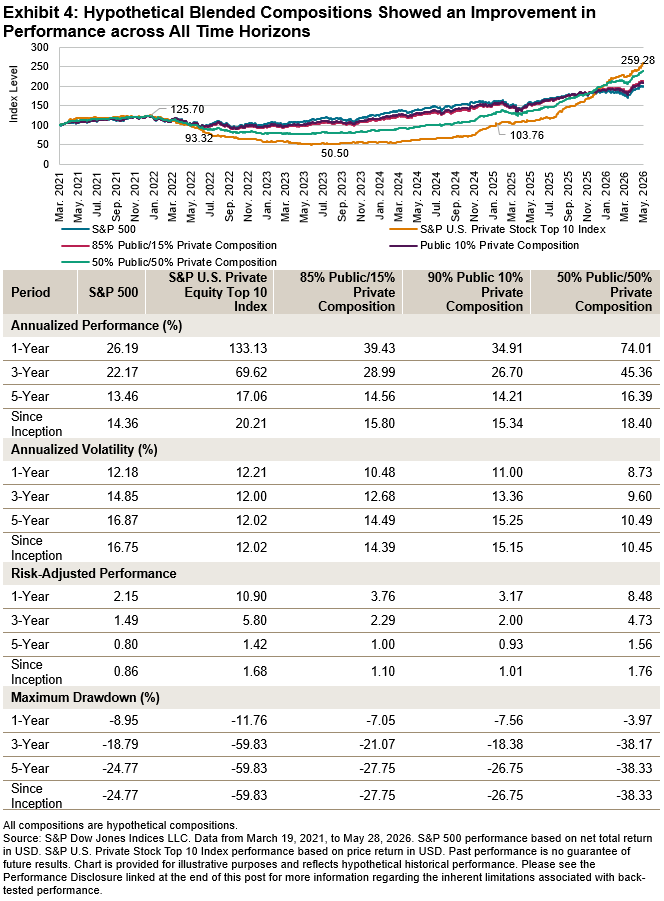
The scenarios in Exhibit 4 illustrate how hypothetical blended compositions showed improved performance over time.

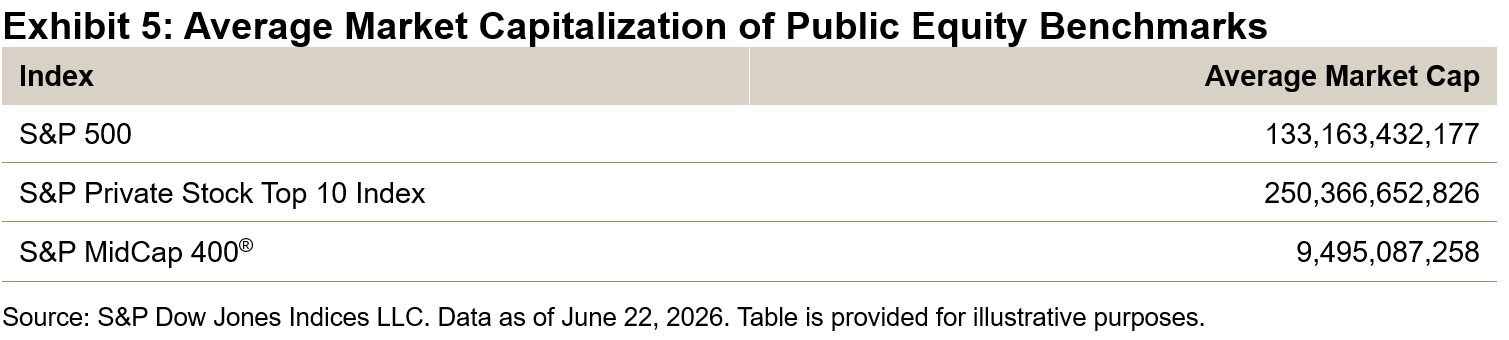
Secondary market developments also suggest that liquidity conditions are improving among the largest private companies.2 This is particularly relevant for the largest constituents represented in emerging private stock indices, where company scale, institutional ownership and secondary market activity may contribute to more observable pricing than in the broader private market universe. The constituents of the S&P Private Stock Top 10 Index have also tended to have average market capitalizations greater than those of mid-cap public equities while remaining lower than the largest constituents of the S&P 500 (see Exhibit 5). This combination of scale and secondary market liquidity may support their inclusion in index-based structures and improve their compatibility with ETF implementation.

A comprehensive representation of the investable equity universe may enable investors to assess both the largest public companies and leading private firms increasingly shaping the global economy—particularly considering that innovation cycles, such as those driven by AI, are often initiated in private markets before scaling into public market leadership. Reflecting both dimensions may therefore lead to a more complete and forward-looking perspective on growth.

1 MEKETA, “The Decreasing Number of Public Companies,” September 2024.

2 J.P.Morgan, “Private market secondaries are booming amid an IPO slowdown,” April 13, 2026.


The posts on this blog are opinions, not advice. Please read our Disclaimers.